

Question: 6.6 Trying to correlate a random data set! Load the y and t data provided in the file HW6data.mat into MATLAB (type: load HW6data). Make
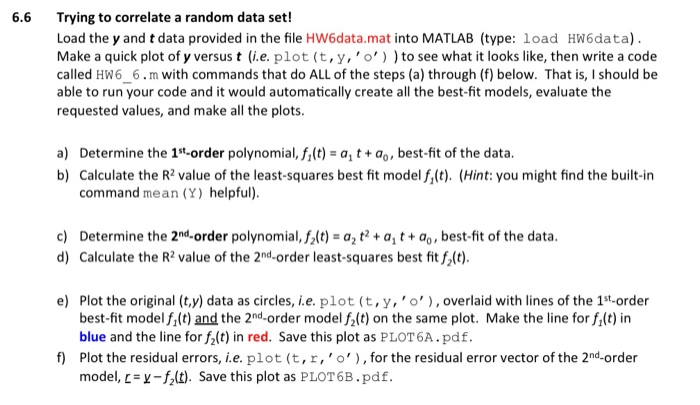
6.6 Trying to correlate a random data set! Load the y and t data provided in the file HW6data.mat into MATLAB (type: load HW6data). Make a quick plot of y versus t (ie. plot (t, y,' o, ) ) to see what it looks like, then write a code called HW6_6.m with commands that do ALL of the steps (a) through (f) below. That is, I should be able to run your code and it would automatically create all the best-fit models, evaluate the requested values, and make all the plots. a) Determine the 1st-order polynomial, flt) -a t+ ao, best-fit of the data b) Calculate the R2 value of the least-squares best fit modelf,(t) (Hint: you might find the built-in command mean (Y) helpful). c) Determine the 2nd-order polynomial, f2lt) -a,t2+ a, t+ ao, best-fit of the data. d) Calculate the R2 value of the 2nd-order least-squares best fit f2(t) e) Plot the original (t,y) data as circles, i.e. plot (t,y,'o),overlaid with lines of the 1st-order best-fit model f,(t) and the 2nd-order model f2(t) on the same plot. Make the line for f,(t) in blue and the line for f2(t) in red. Save this plot as PLOT6A.pdf. f) Plot the residual errors, i.e. plot (t,r, 'o'), for the residual error vector of the 2nd-order model, L= y-flt). Save this plot as PLOT 6B . pdf
Step by Step Solution
There are 3 Steps involved in it
MATLAB Solution for Correlating a Random Data Set Below is a detailed MATLAB script HW66m that perfo... View full answer

Get step-by-step solutions from verified subject matter experts