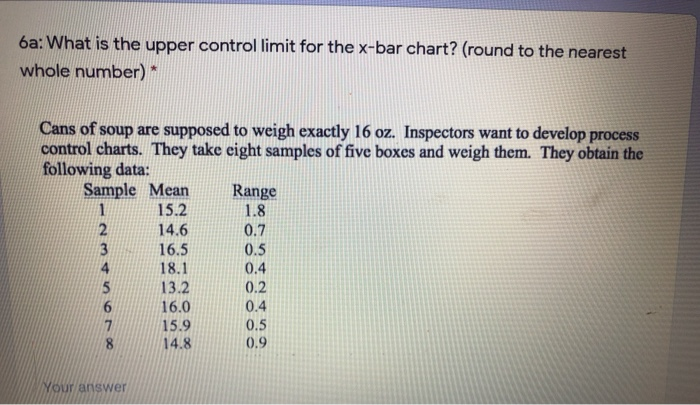
Question: 6a: What is the upper control limit for the x-bar chart? (round to the nearest whole number) * Cans of soup are supposed to weigh

6a: What is the upper control limit for the x-bar
6a: What is the upper control limit for the x-bar chart? (round to the nearest whole number) * Cans of soup are supposed to weigh exactly 16 oz. Inspectors want to develop process control charts. They take eight samples of five boxes and weigh them. They obtain the following data: Sample Mean Range 1 15.2 1.8 2 14.6 0.7 3 16.5 0.5 4 18.1 0.4 5 13.2 0.2 6 16.0 0.4 7 15.9 0.5 14.8 0.9 8 Your

Step by Step Solution

There are 3 Steps involved in it

1 Expert Approved Answer
Step: 1 Unlock blur-text-image
Question Has Been Solved by an Expert!

Get step-by-step solutions from verified subject matter experts

Step: 2 Unlock
Step: 3 Unlock

Students Have Also Explored These Related General Management Questions!