

Question: 7 . ( 1 2 Points ) Top Broadcast Shows. The networks for the top 2 0 television shows, as determined by the Nielsen Ratings
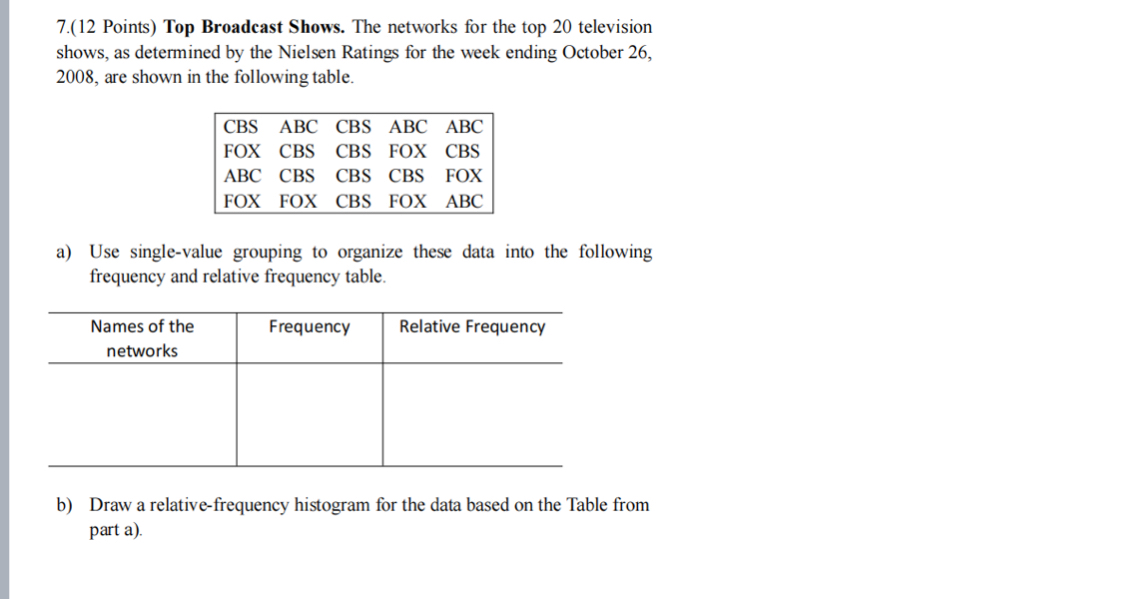
Points Top Broadcast Shows. The networks for the top television shows, as determined by the Nielsen Ratings for the week ending October are shown in the following table.
tableCBSABC,CBSABC,ABCFOXCBSCBSFOX,CBSABCCBSCBSCBSFOXFOXFOX,CBSFOX,ABC
a Use singlevalue grouping to organize these data into the following frequency and relative frequency table.
tabletableNames of thenetworksFrequency,Relative Frequency
b Draw a relativefrequency histogram for the data based on the Table from part a
Step by Step Solution
There are 3 Steps involved in it
1 Expert Approved Answer
Step: 1 Unlock

Question Has Been Solved by an Expert!
Get step-by-step solutions from verified subject matter experts
Step: 2 Unlock
Step: 3 Unlock