

Question: 7/ 10. Below is a frequency distribution for the heights of a class of 5th graders, in terms of leftover inches when measured in feet.
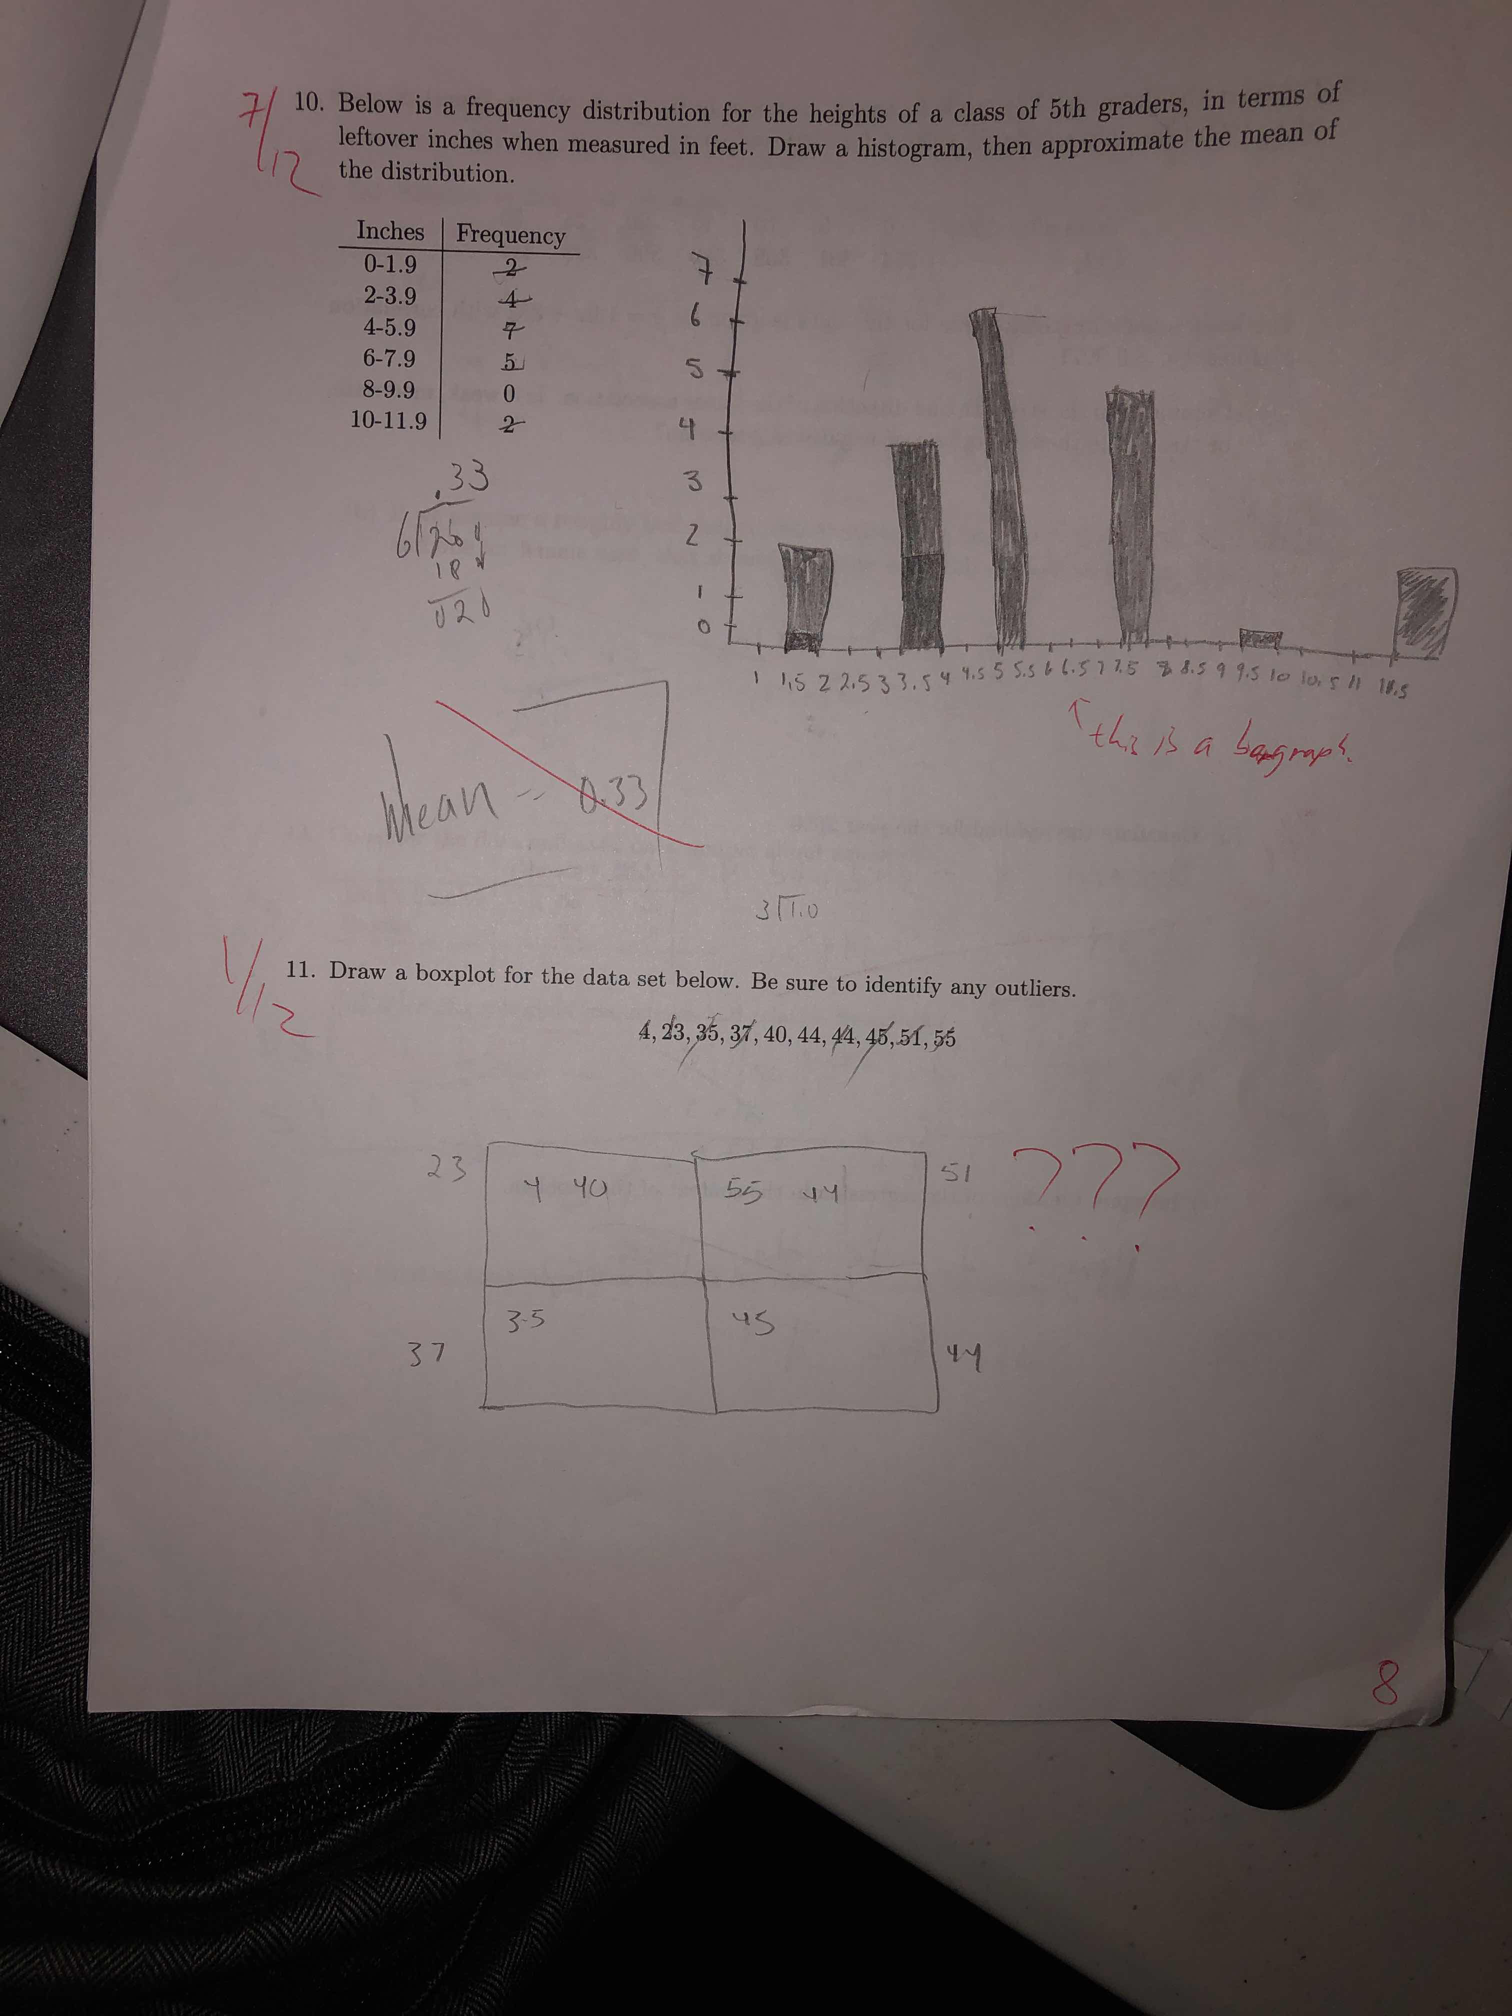
7/ 10. Below is a frequency distribution for the heights of a class of 5th graders, in terms of leftover inches when measured in feet. Draw a histogram, then approximate the mean of the distribution. Inches Frequency 0-1.9 2 2-3.9 4 4-5.9 7 o + 6- 7.9 51 8-9.9 0 10-11.9 133 18 N 1 1 15 2 2, 5 3 3 . 5 4 4. 5 5 5.5 6 6. 5 7 7.5 8 8.5 9 9.5 10 10,5 /1 10.5 this is a bangmaps. Mean - 833 317.0 11. Draw a boxplot for the data set below. Be sure to identify any outliers. 4, 23, 35, 37, 40, 44, 44, 45,51, 55 23 14 40 55 44 51 ? ? ? 3-5 45 3 7
Step by Step Solution
There are 3 Steps involved in it
1 Expert Approved Answer
Step: 1 Unlock

Question Has Been Solved by an Expert!
Get step-by-step solutions from verified subject matter experts
Step: 2 Unlock
Step: 3 Unlock