

Question: '7. [17 marks] Consider the model: Y,- = or +335, + R,- , where R; ~ G(0,a), i = 1,...,n; independent Suppose thatwe are interested
!['7. [17 marks] Consider the model: Y,- = or +335, +](https://dsd5zvtm8ll6.cloudfront.net/si.experts.images/questions/2024/10/670906462d6e1_67867090646063d0.jpg)
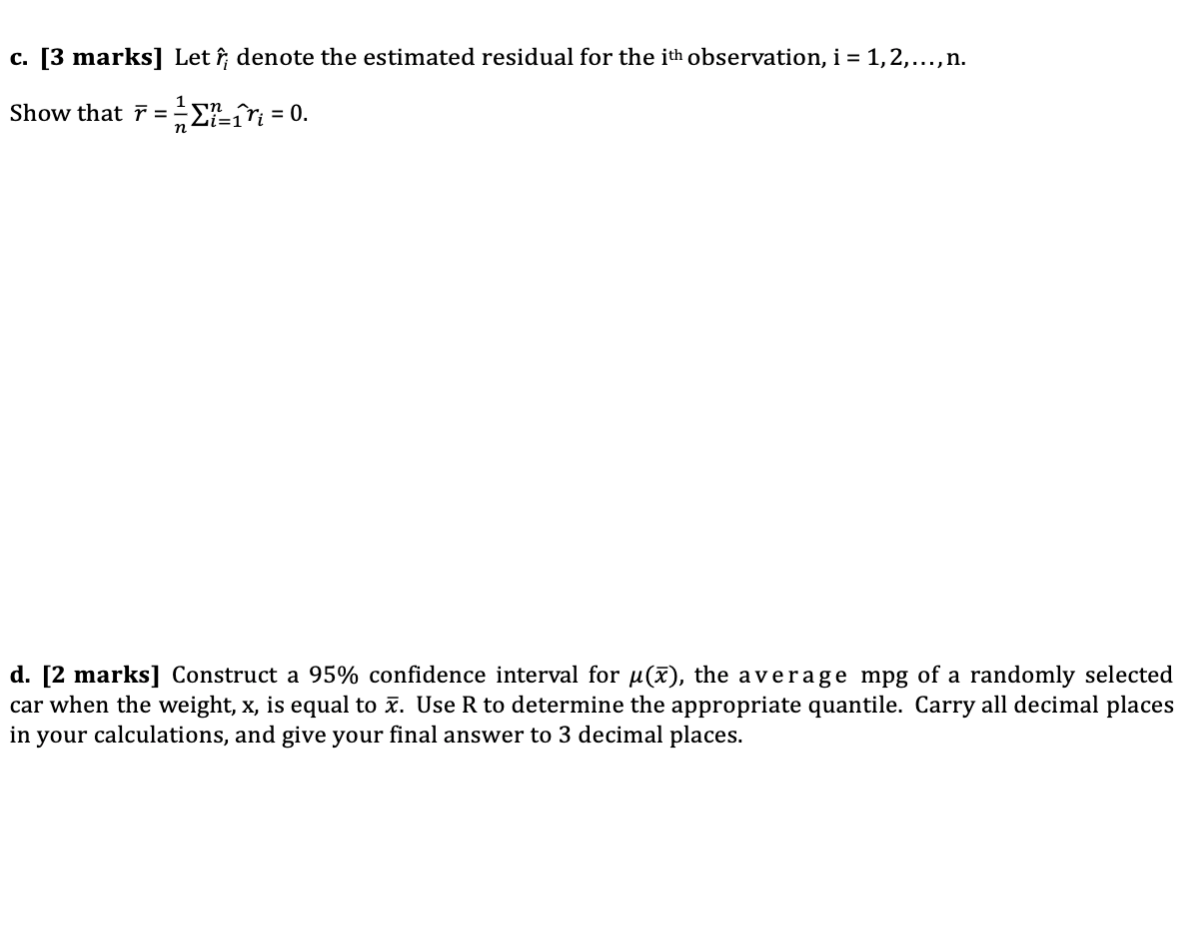
'7. [17 marks] Consider the model: Y,- = or +335, + R,- , where R; ~ G(0,a), i = 1,...,n; independent Suppose thatwe are interested in determining if there is a linear relationship between the miles per gallon (Y, measured in mpg) of a randomly selected car and the car's weight (1:, given in thousands of pounds). Data are collected on 30 cars. The simple linear regression model above is fit to the data and the summary statistics are given below: i = 20.2167, 2? = 3.2201, 51/? = 1,097.9417, SH = 29.3629, Sxy = 156.2596, Se = 3.08 a. [3 marks] Using the summary information above, determine the least squares estimates for a and B, and then W. b. [2 marks] Give an interpretation of each least squares estimate found in part a., in the context of the question. c. [3 marks] Let i'; denote the estimated residual for the in! observation, i = 1, 2, ...,n. Show that 1- = izgfn = o. d. [2 marks] Construct a 95% condence interval for 11(2), the average mpg of a randomly selected car when the weight, x, is equal to 2?. Use R to determine the appropriate quantile. Carry all decimal places in your calculations, and give your nal answer to 3 decimal places. e. Conduct a two-sided hypothesis test in order to determine if there is evidence that mpg is linearly related to weight. Follow the steps outlined below in order to conduct such an hypothesis test: i.[2 marks] State the null and alternative hypotheses in terms of the appropriate population parameter. ll. [2 marks] State the appropriate test statistic to be used. giving its distribution assuming HCl is true, including degrees of freedom if necessary. Do not calculate a value here. iii. [2 marks] Now calculate the observed value of the test statistic and use it to calculate the p-value to test Ha. Use R to determine the appropriate p-value. Include all R code used. W deamaLnlases- iv. [1 mark] Clearly state your conclusion, in the context of the question, using Table 5.1 guidelines from the Course Notes
Step by Step Solution
There are 3 Steps involved in it

Get step-by-step solutions from verified subject matter experts