

Question: 7. (18 points) Consider the data obtained in a study on students' grade point average (GPA) and final scores of seven randomly selected students from


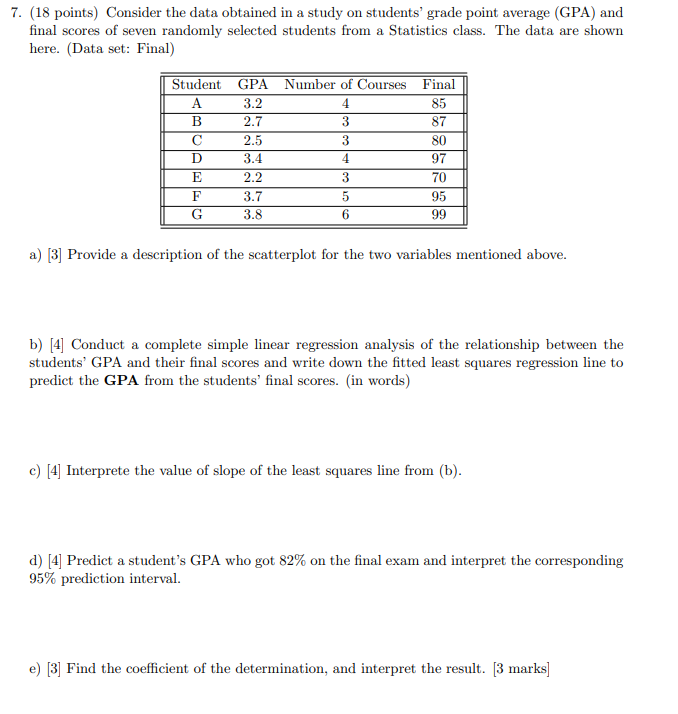
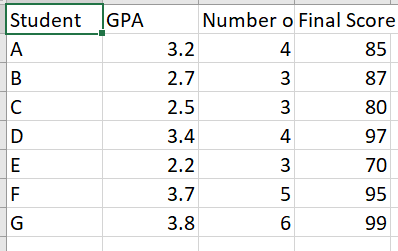
7. (18 points) Consider the data obtained in a study on students' grade point average (GPA) and final scores of seven randomly selected students from a Statistics class. The data are shown here. (Data set: Final) Student GPA Number of Courses Final A 3.2 4 85 B 2.7 3 87 C 2.5 3 80 D 3.4 4 97 E 2.2 3 70 F 3.7 5 95 G 3.8 6 99 a) [3] Provide a description of the scatterplot for the two variables mentioned above. b) [4] Conduct a complete simple linear regression analysis of the relationship between the students' GPA and their final scores and write down the fitted least squares regression line to predict the GPA from the students' final scores. (in words) c) [4] Interprete the value of slope of the least squares line from (b). d) [4] Predict a student's GPA who got 82% on the final exam and interpret the corresponding 95% prediction interval. e) [3] Find the coefficient of the determination, and interpret the result. [3 marks]Student GPA Number o Final Score A 3.2 85 B 2.7 87 C 2.5 80 D 3.4 97 O U W A W W E 2.2 70 F 3.7 95 G 3.8 99
Step by Step Solution
There are 3 Steps involved in it

Get step-by-step solutions from verified subject matter experts