

Question: 7. (3pts total) Consider the following table and scatterplot of annual dollar amount spent on advertising (in millions) vs. annual dollar amount of sales (in
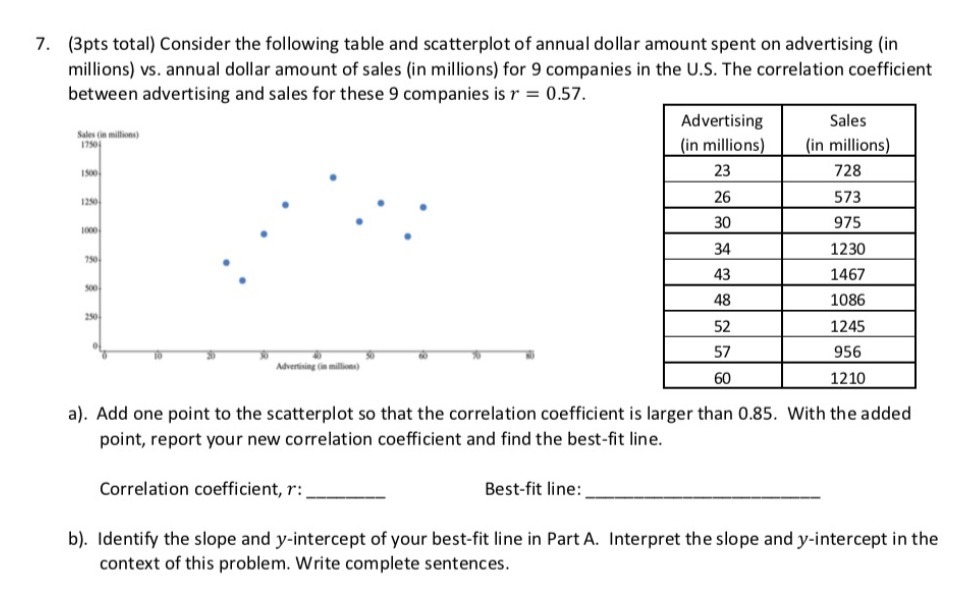
7. (3pts total) Consider the following table and scatterplot of annual dollar amount spent on advertising (in millions) vs. annual dollar amount of sales (in millions) for 9 companies in the U.S. The correlation coefficient between advertising and sales for these 9 companies is r = 0.57. Sales (in millions) Advertising Sales 1750 (in millions) (in millions) 1500 23 728 1250 26 573 1060 30 975 750 34 1230 43 1467 48 1086 250 52 1245 57 956 Advertising In millions 60 1210 a). Add one point to the scatterplot so that the correlation coefficient is larger than 0.85. With the added point, report your new correlation coefficient and find the best-fit line. Correlation coefficient, r: Best-fit line: b). Identify the slope and y-intercept of your best-fit line in Part A. Interpret the slope and y-intercept in the context of this problem. Write complete sentences
Step by Step Solution
There are 3 Steps involved in it

Get step-by-step solutions from verified subject matter experts