

Question: 7. (6 pts) An experimental relationship between Current (1) & Time (t) is shown in Figure 1. Determine the slope and the intercept of the
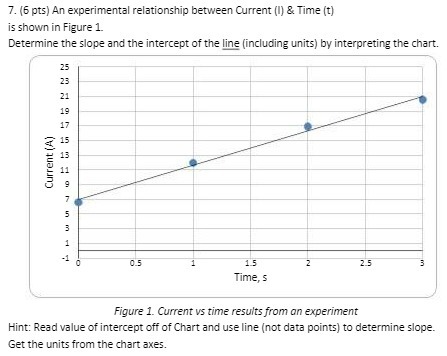
7. (6 pts) An experimental relationship between Current (1) & Time (t) is shown in Figure 1. Determine the slope and the intercept of the line (including units) by interpreting the chart. 25 23 21 19 17 15 13 Current (A) 2 5 0.5 1 5 Time, 5 Figure 1. Current vs time results from an experiment Hint: Read value of intercept off of Chart and use line (not data points) to determine slope. Get the units from the chart axes
Step by Step Solution
There are 3 Steps involved in it
1 Expert Approved Answer
Step: 1 Unlock

Question Has Been Solved by an Expert!
Get step-by-step solutions from verified subject matter experts
Step: 2 Unlock
Step: 3 Unlock