

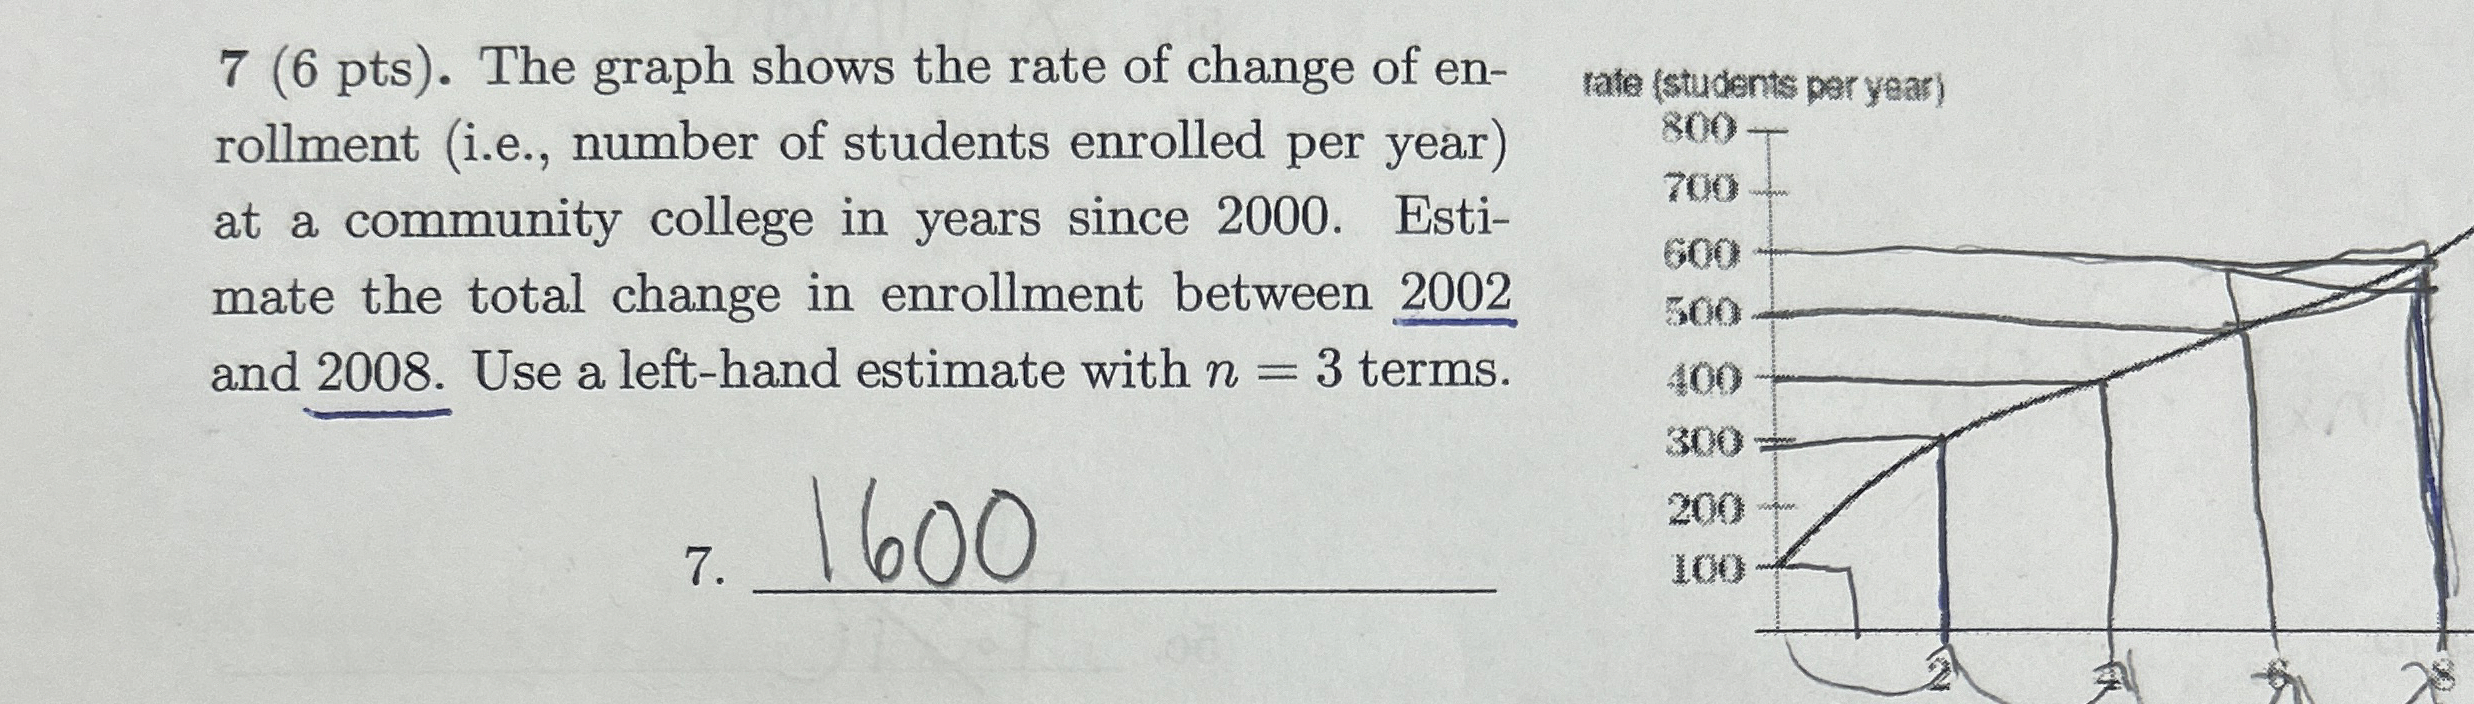
Question: 7 ( 6 pts ) . The graph shows the rate of change of enrollment ( i . e . , number of students enrolled
pts The graph shows the rate of change of enrollment ie number of students enrolled per year at a community college in years since Estimate the total change in enrollment between and Use a lefthand estimate with terms.
vate students per years
amas
Step by Step Solution
There are 3 Steps involved in it
1 Expert Approved Answer
Step: 1 Unlock

Question Has Been Solved by an Expert!
Get step-by-step solutions from verified subject matter experts
Step: 2 Unlock
Step: 3 Unlock