

Question: 7 . ( 7 0 pts ) The power curve for the Vestas V 8 2 wind turbine has been provided, and the relevant data
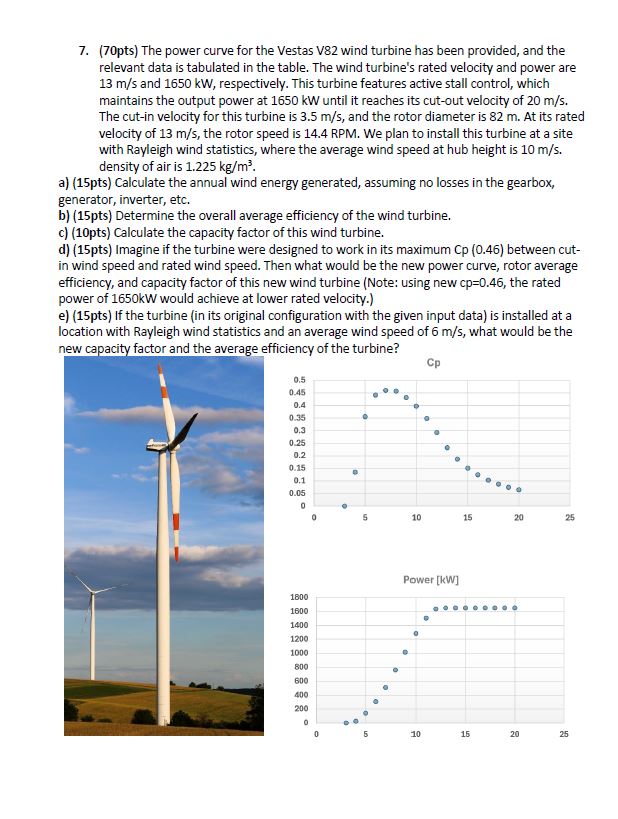
pts The power curve for the Vestas V wind turbine has been provided, and the relevant data is tabulated in the table. The wind turbine's rated velocity and power are mathrm~mmathrms and kW respectively. This turbine features active stall control, which maintains the output power at kW until it reaches its cutout velocity of mathrm~mmathrms The cutin velocity for this turbine is mathrm~mmathrms and the rotor diameter is m At its rated velocity of mathrm~mmathrms the rotor speed is RPM We plan to install this turbine at a site with Rayleigh wind statistics, where the average wind speed at hub height is mathrm~mmathrms density of air is mathrm~kgmathrmm
apts Calculate the annual wind energy generated, assuming no losses in the gearbox, generator, inverter, etc.
bpts Determine the overall average efficiency of the wind turbine.
cpts Calculate the capacity factor of this wind turbine.
dpts Imagine if the turbine were designed to work in its maximum Cp between cutin wind speed and rated wind speed. Then what would be the new power curve, rotor average efficiency, and capacity factor of this new wind turbine Note: using new mathrmcp the rated power of kW would achieve at lower rated velocity.
epts If the turbine in its original configuration with the given input data is installed at a location with Rayleigh wind statistics and an average wind speed of mathrm~mmathrms what would be the new capacity factor and the average efficiency of the turbine? begintabularccc
hline multicolumnlTable: Vestas VMW wind turbine data
hline Wind Speed ms & Power kW & Cp
hline & &
hline & &
hline & &
hline & &
hline & &
hline & &
hline & &
hline & &
hline & &
hline & &
hline & &
hline & &
hline & &
hline & &
hline & &
hline & &
hline & &
hline & &
hline
endtabular
Step by Step Solution
There are 3 Steps involved in it
1 Expert Approved Answer
Step: 1 Unlock

Question Has Been Solved by an Expert!
Get step-by-step solutions from verified subject matter experts
Step: 2 Unlock
Step: 3 Unlock