

Question: 7. /7 Using the data in the table below (collected in our day 1 questionnaire, where a score of 1=highly disagree, and 7=highly agree), generate
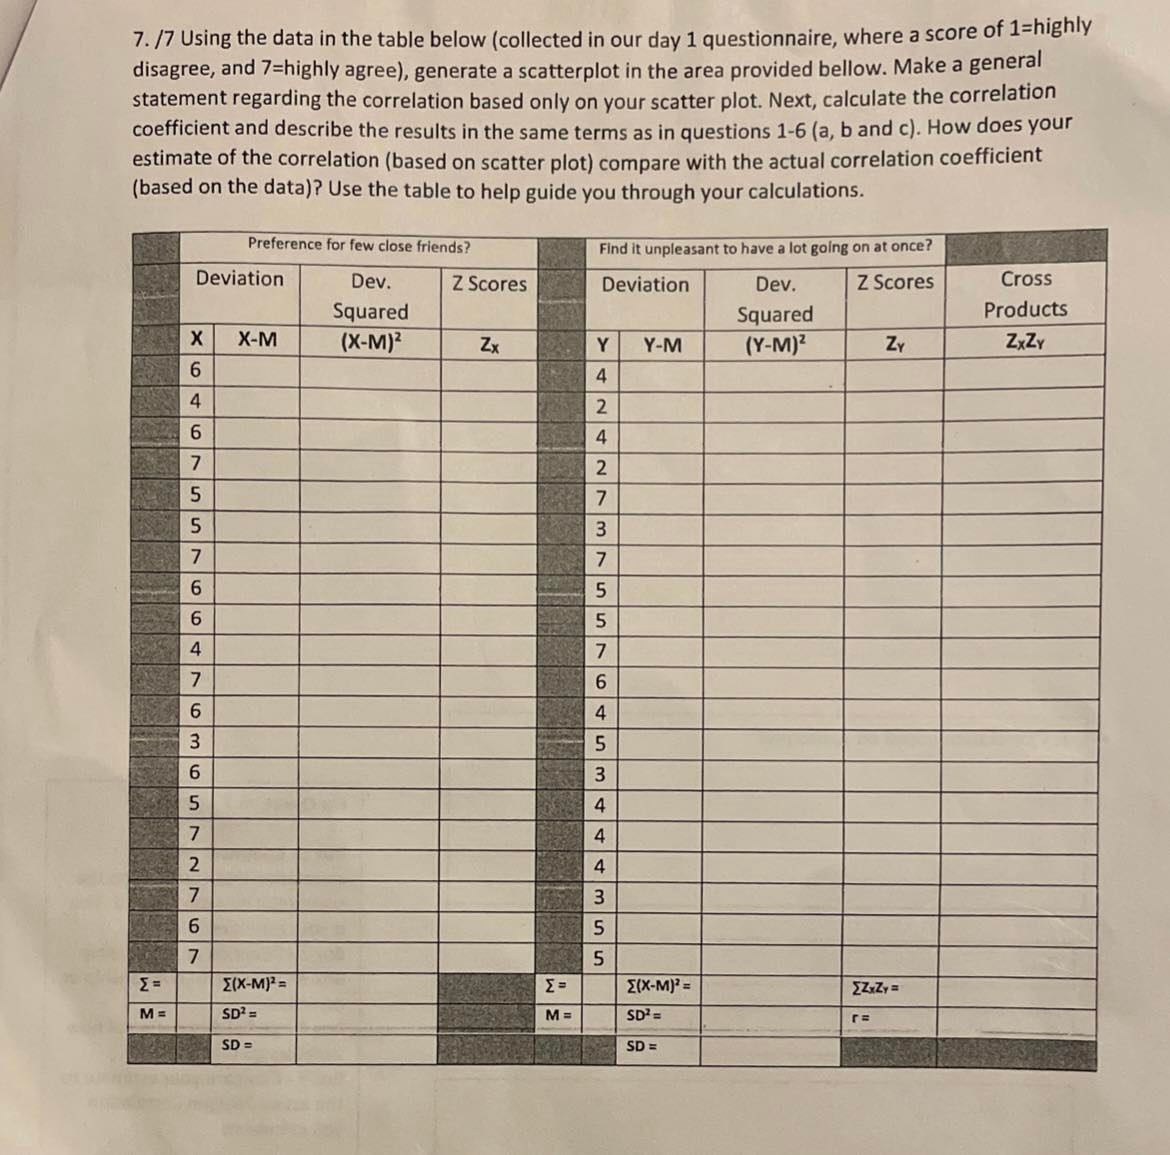
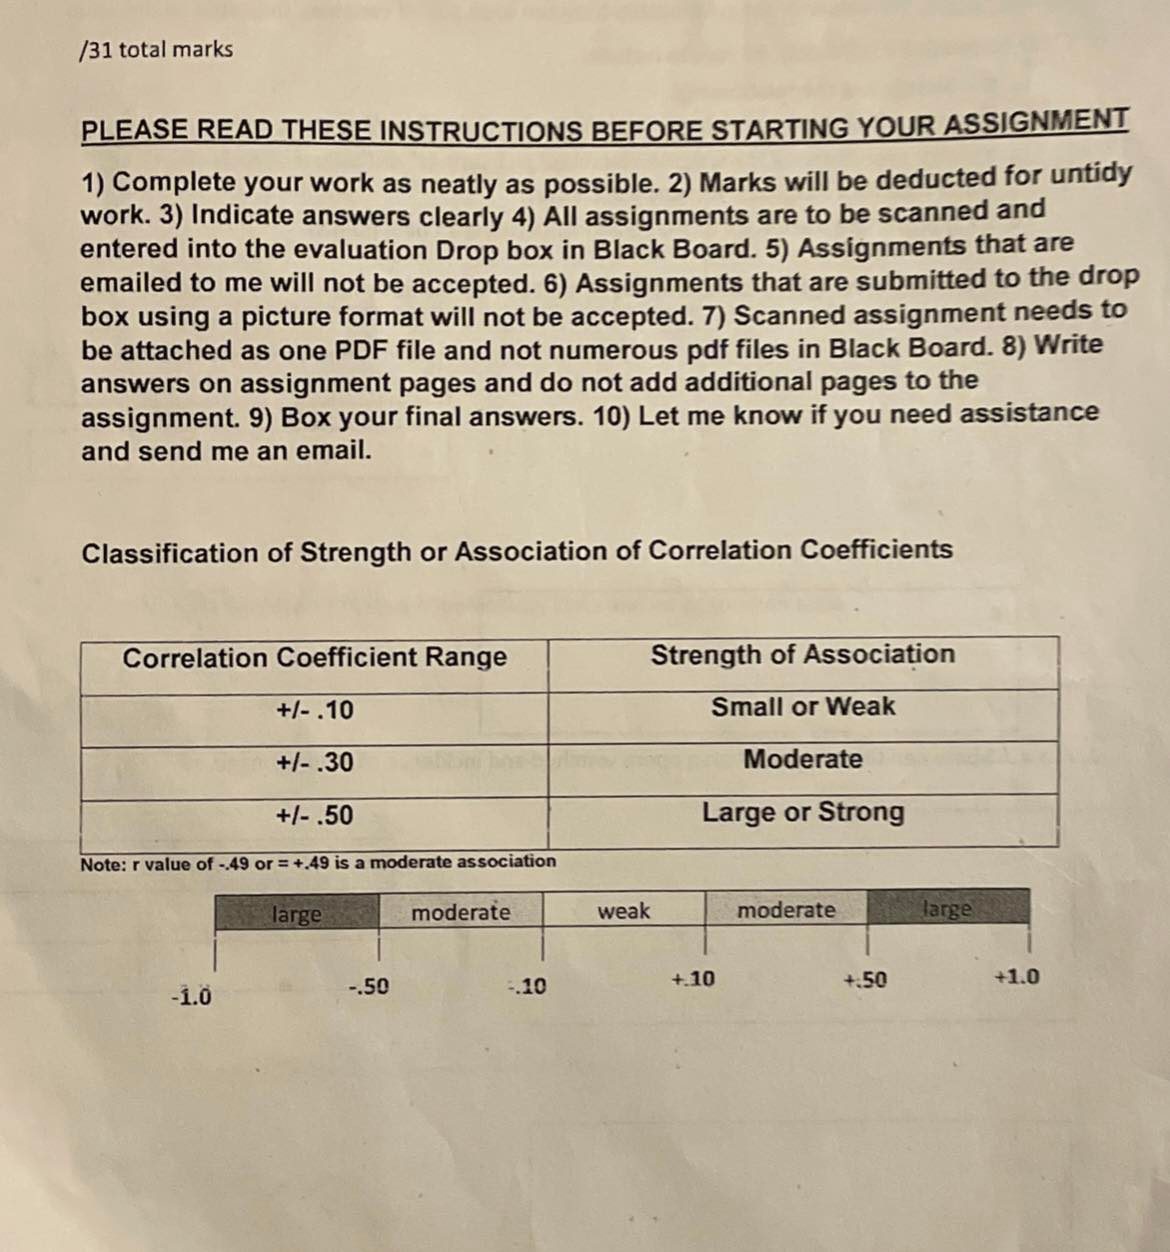

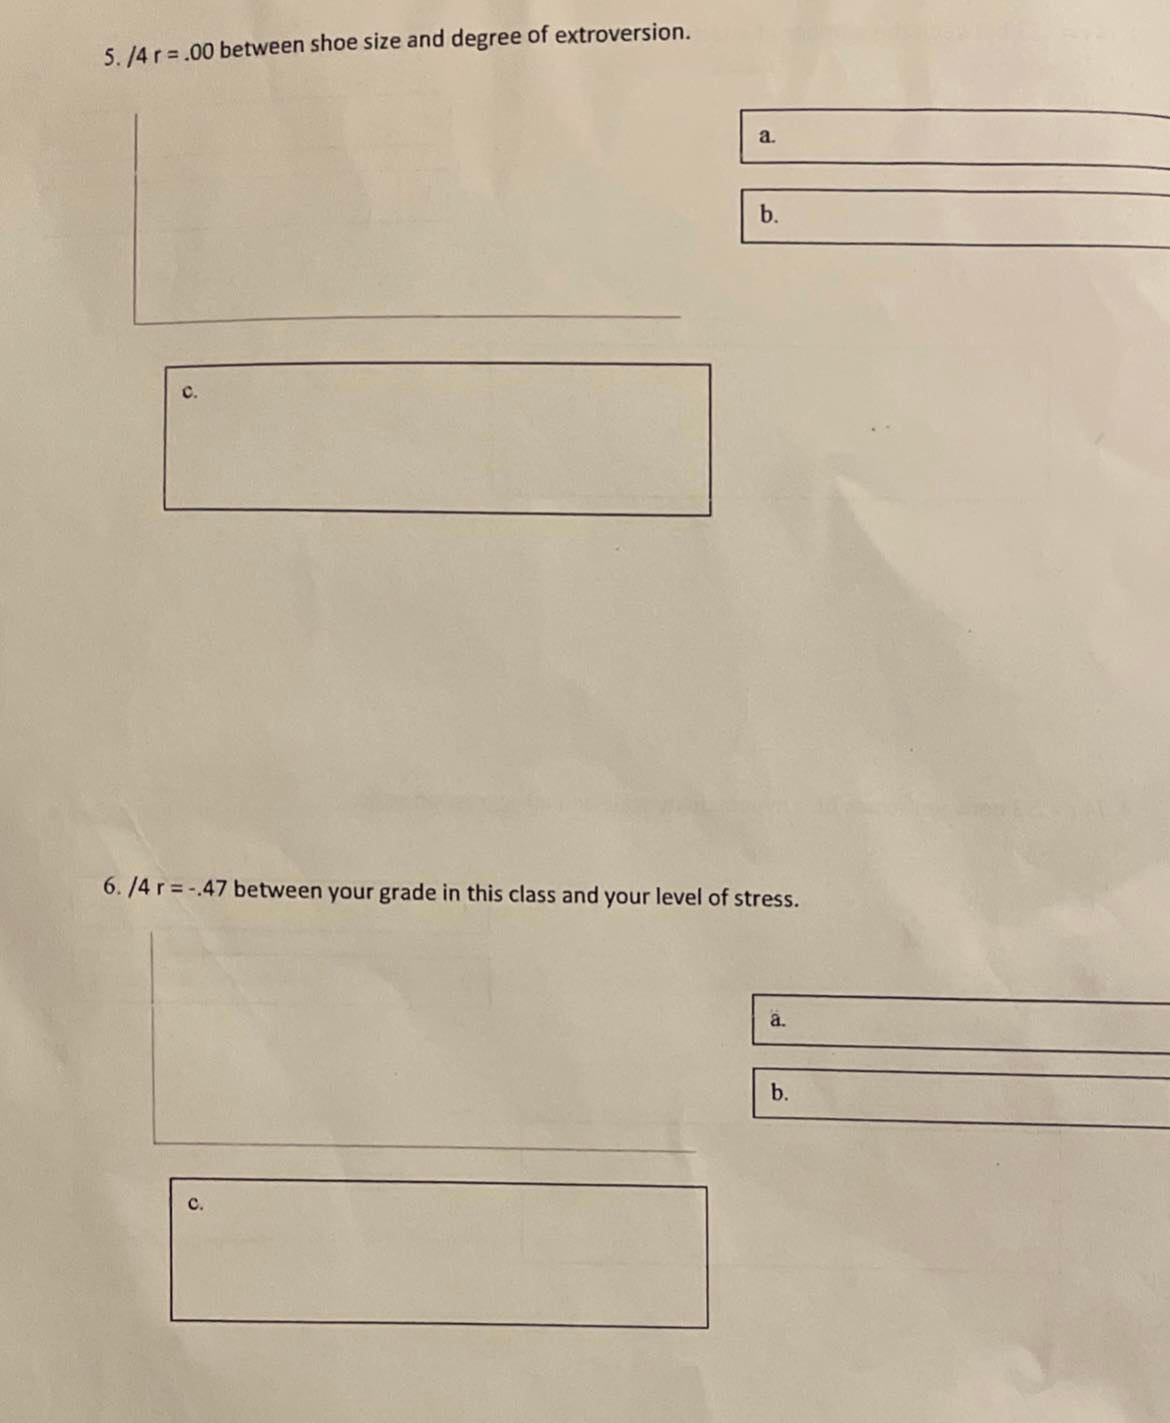


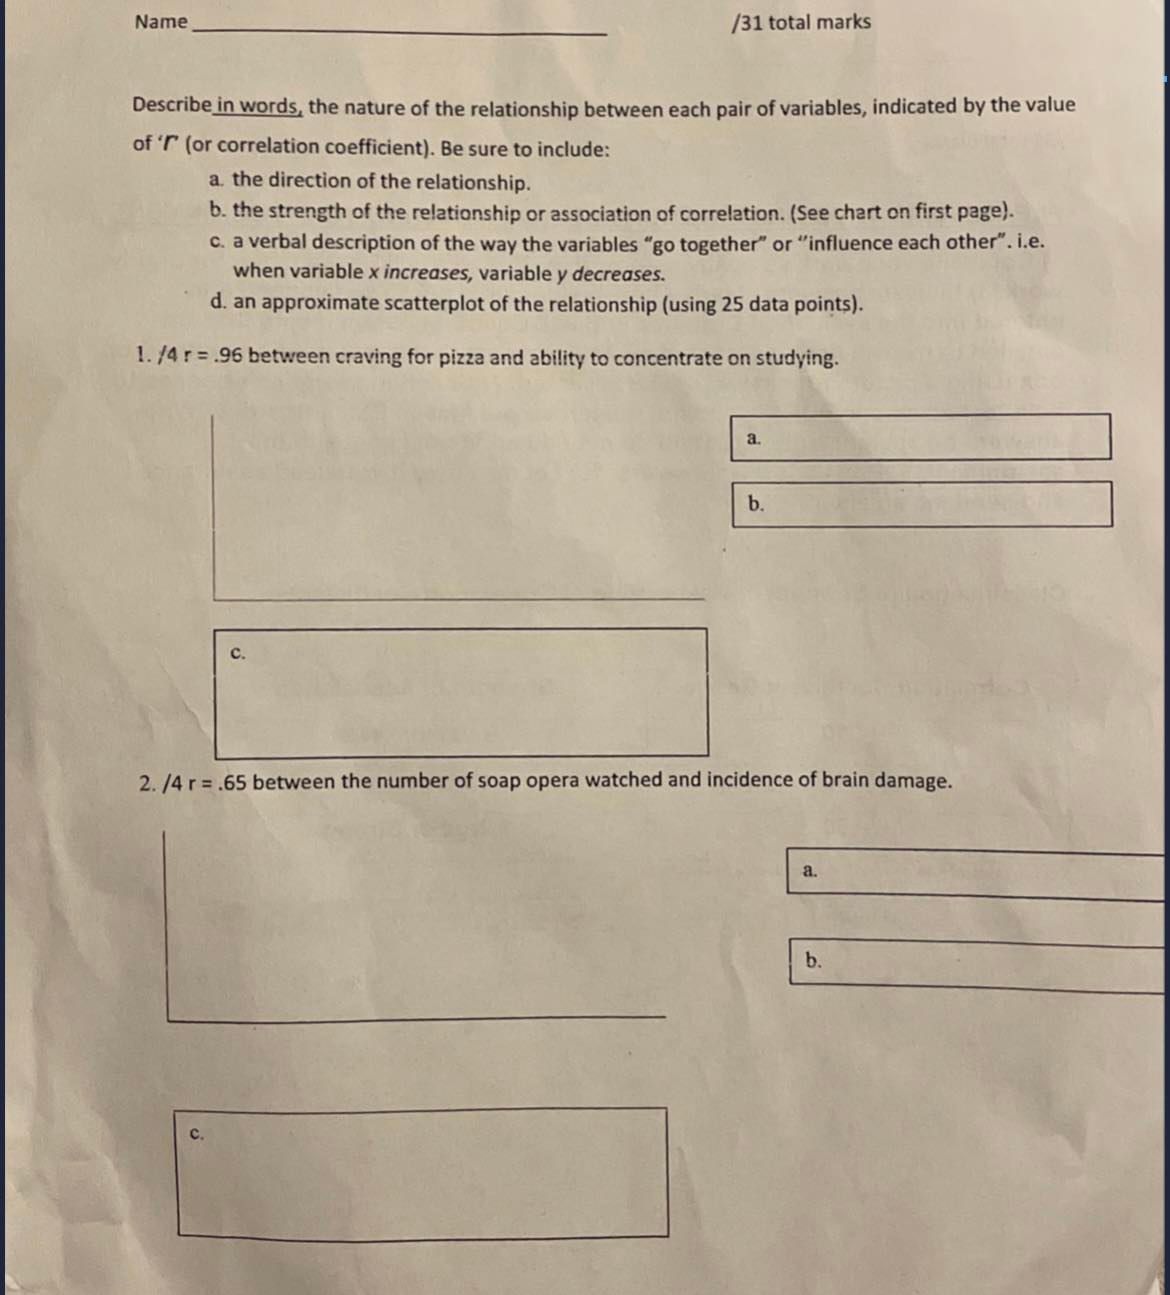

7. /7 Using the data in the table below (collected in our day 1 questionnaire, where a score of 1=highly disagree, and 7=highly agree), generate a scatterplot in the area provided bellow. Make a general statement regarding the correlation based only on your scatter plot. Next, calculate the correlation coefficient and describe the results in the same terms as in questions 1-6 (a, b and c). How does your estimate of the correlation (based on scatter plot) compare with the actual correlation coefficient (based on the data)? Use the table to help guide you through your calculations. Preference for few close friends? Find it unpleasant to have a lot going on at once? Deviation Dev. Z Scores Deviation Dev Z Scores Cross Squared Squared Products X X-M (X-M) Zx Y Y-M (Y-M) Zy Zx Zy 6 4 4 2 6 4 7 2 5 7 7 2 7 6 S = E(X-M) = E(X-M)' = [ZxZy = M = SD? = M= SD? = r= SD = SD =/31 total marks PLEASE READ THESE INSTRUCTIONS BEFORE STARTING YOUR ASSIGNMENT 1) Complete your work as neatly as possible. 2) Marks will be deducted for untidy work. 3) Indicate answers clearly 4) All assignments are to be scanned and entered into the evaluation Drop box in Black Board. 5) Assignments that are emailed to me will not be accepted. 6) Assignments that are submitted to the drop box using a picture format will not be accepted. 7) Scanned assignment needs to be attached as one PDF file and not numerous pdf files in Black Board. 8) Write answers on assignment pages and do not add additional pages to the assignment. 9) Box your final answers. 10) Let me know if you need assistance and send me an email. Classification of Strength or Association of Correlation Coefficients Correlation Coefficient Range Strength of Association +/-.10 Small or Weak +/-.30 Moderate +/-.50 Large or Strong Note: r value of -.49 or = +.49 is a moderate association large moderate weak moderate large -.10 +.10 +:50 +1.0 1.0 -.50Name /31 total marks Describe in words, the nature of the relationship between each pair of variables, indicated by the value of 'r' (or correlation coefficient). Be sure to include: a. the direction of the relationship. b. the strength of the relationship or association of correlation. (See chart on first page). c. a verbal description of the way the variables "go together" or "influence each other". i.e. when variable x increases, variable y decreases. d. an approximate scatterplot of the relationship (using 25 data points). 1. /4 r = .96 between craving for pizza and ability to concentrate on studying. a. b. 2. /4 r = .65 between the number of soap opera watched and incidence of brain damage. a. b.5. /4 r =.00 between shoe size and degree of extroversion. a b. C. 6. /4 r = -.47 between your grade in this class and your level of stress. a. b.1. Correlation based on scatterplot: For Question 7 Box 1 - Comment on the correlation that you base on the scatterplot you constructed. This is your estimate. 2 Box 2 - Direction of relationship Box 3 - Strength of relationship or association 3 Box 4 - Verbal description of how variables go together. Box 5 - Compare your estimate to 4. the actual Pearson Correlation you calculated. 5. How does your estimate compare to the 'r' value you calculated?3. /4 r = -.23 between the number of interfering mothers-in-law and the number of happy marriages. a. b 4. /4 r = .33 between scores on a hyperactivity scale and an aggression scale. a. b
Step by Step Solution
There are 3 Steps involved in it

Get step-by-step solutions from verified subject matter experts