

Question: 7 8. 9. 10. O Each year Forbes ranks the world's most valuable brands. A portion of the data for 82 of the brands
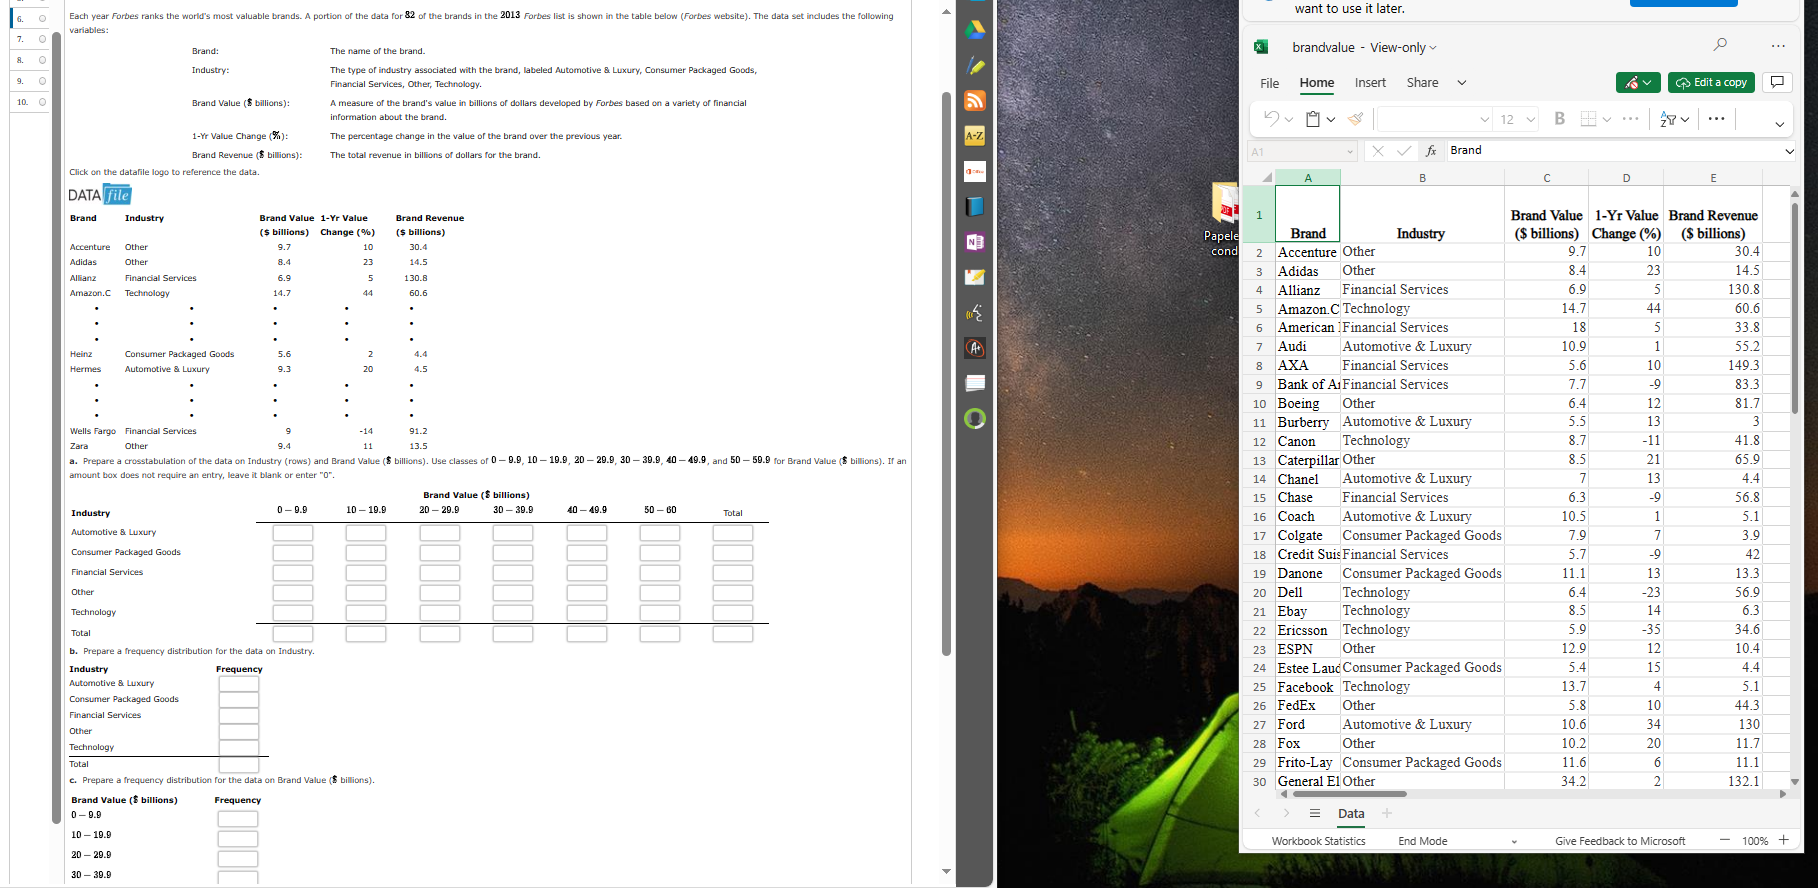
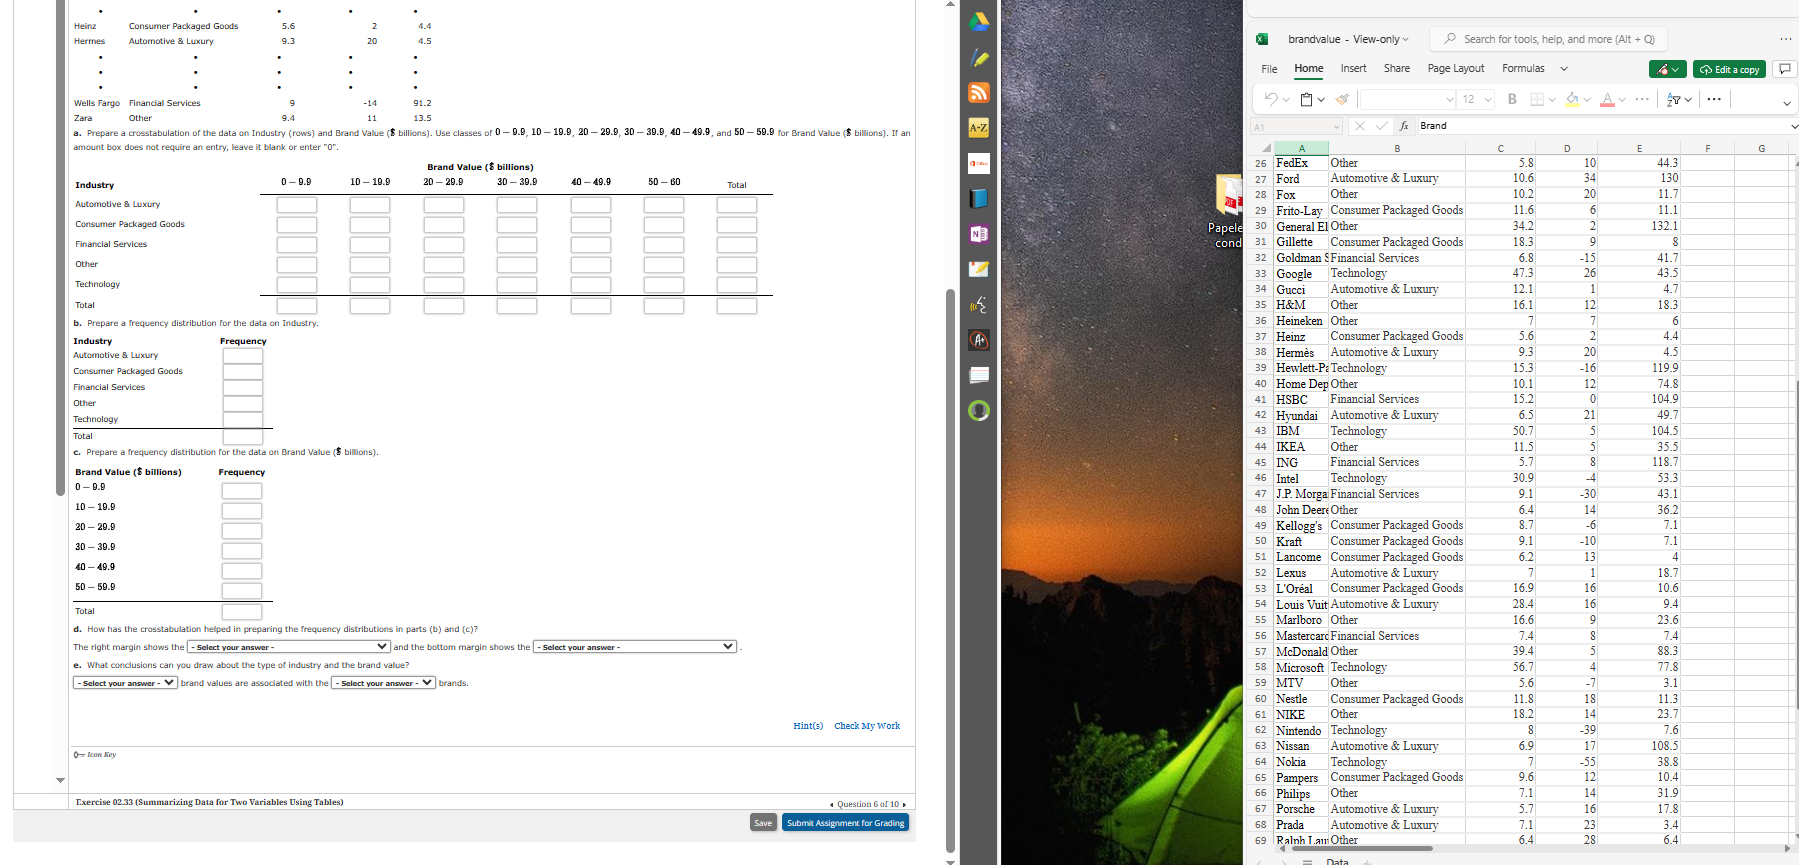
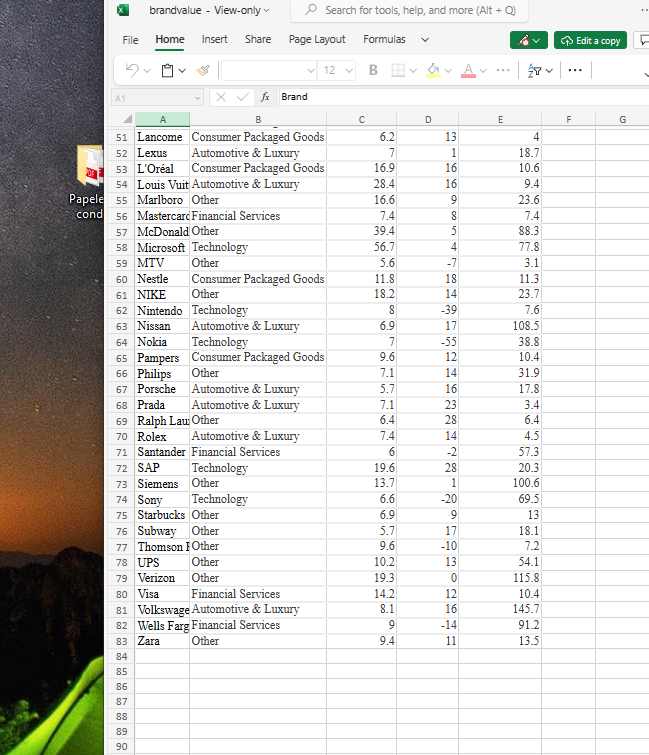
7 8. 9. 10. O Each year Forbes ranks the world's most valuable brands. A portion of the data for 82 of the brands in the 2013 Forbes list is shown in the table below (Forbes website). The data set includes the following variables: Brand: Industry: The name of the brand. The type of industry associated with the brand, labeled Automotive & Luxury, Consumer Packaged Goods, Financial Services, Other, Technology. Brand Value ($ billions): A measure of the brand's value in billions information about the brand. dollars developed by Forbes based on a variety of financial 1-Yr Value Change (%): The percentage change in the value of the brand over the previous year. Brand Revenue ($ billions): The total revenue billions dollars for the brand. Click on the datafile logo to reference the data. DATA file Brand Industry Brand Value 1-Yr Value Brand Revenue ($ billions) Change (%) ($ billions) Accenture Other 9.7 10 30.4 Adidas Other 8.4 23 14.5 Allianz Financial Services 6.9 130.8 Amazon.c Technology 14.7 60.6 Heinz Consumer Packaged Goods Hermes Automotive & Luxury Wells Fargo Financial Services Zara Other 9.3 9.4 -14 11 91.2 13.5 a. Prepare a crosstabulation of the data on Industry (rows) and Brand Value ($ billions). Use classes of 0-9.9, 10-19.9, 20-29.9, 30-39.9, 40-49.9, and 50-59.9 for Brand Value ($ billions). If an amount box does not require an entry, leave it blank or enter "0". Industry Automotive & Luxury 0-9.9 10-19.9 Brand Value ($ billions) 20-29.9 30 39.9 40-49.9 50-60 Total Consumer Packaged Goods Financial Services Other Technology Total b. Prepare a frequency distribution for the data on Industry. Industry Automotive & Luxury Consumer Packaged Goods Financial Services Other Technology Total Frequency c. Prepare a frequency distribution for the data on Brand Value (billions). Brand Value ($ billions) 0-9.9 Frequency 10-19.9 20-29.9 30-39.9 want to use it later. brandvalue -View-only~ File Home Insert Share Edit a copy 12 B A1 fx Brand A B C D 1 Papele Brand Industry ($ billions) Change (%) Brand Value 1-Yr Value Brand Revenue ($ billions) cond 2 Accenture Other 9.7 10 30.4 3 Adidas Other 8.4 23 14.5 4 Allianz Financial Services 6.9 5 130.8 5 Amazon.C Technology 14.7 44 60.6 6 American Financial Services 18 5 33.8 7 Audi Automotive & Luxury 10.9 1 55.2 8 AXA Financial Services 5.6 10 149.3 9 Bank of A Financial Services 7.7 -9 83.3 10 Boeing Other 6.4 12 81.7 11 Burberry Automotive & Luxury 5.5 13 3 12 Canon Technology 8.7 -11 41.8 13 Caterpillar Other 8.5 21 65.9 14 Chanel Automotive & Luxury 7 13 4.4 15 Chase Financial Services 6.3 -9 56.8 16 Coach Automotive & Luxury 10.5 1 5.1 17 Colgate Consumer Packaged Goods 7.9 7 3.9 18 Credit Suis Financial Services 5.7 -9 42 19 Danone Consumer Packaged Goods 11.1 13 13.3 20 Dell Technology 6.4 -23 56.9 21 Ebay Technology 8.5 14 6.3 22 Ericsson Technology 5.9 -35 34.6 23 ESPN Other 12.9 12 10.4 24 Estee Laud Consumer Packaged Goods 5.4 15 4.4 25 Facebook Technology 13.7 4 5.1 26 FedEx Other 5.8 10 44.3 27 Ford Automotive & Luxury 10.6 34 130 28 Fox Other 10.2 20 29 Frito-Lay Consumer Packaged Goods 30 General El Other 11.6 34.2 262 11.7 11.1 132.1 = Data Workbook Statistics End Mode Give Feedback to Microsoft 100% + 1 Heinz Consumer Packaged Goods Hermes Automotive & Luxury Wells Fargo Financial Services Zara Other -14 11 13.5 a. Prepare a crosstabulation of the data on Industry (rows) and Brand Value ($ billions). Use classes or 0-9.9, 10-19.9, 20-29.9, 30-39.9, 40-49.9, and 50-59.9 for Brand Value ($ billions). If an amount box does not require an entry, leave it blank or enter "0". 10-19.9 Brand Value ($ billions) 20-29.9 30-39.9 40-49.9 50-60 Total Industry Automotive & Luxury Consumer Packaged Goods Financial Services Other Technology Total 0-9.9 b. Prepare a frequency distribution for the data on Industry. Industry Automotive & Luxury Consumer Packaged Goods Financial Services Other Technology Total Frequency c. Prepare a frequency distribution for the data on Brand Value billions). Brand Value ($ billions) 0-9.9 Frequency 10-19.9 20-29.9 30-39.9 40-49.9 50-59.9 Total d. How has the crosstabulation helped in preparing the frequency distributions in parts (b) and (c)? The right margin shows the -Select your answer- and the bottom margin shows the -Select your answer- e. What conclusions can you draw about the type of industry and the brand value? - Select your answer-brand values are associated with the -Select your answer -brands. Icon Key Exercise 02.33 (Summarizing Data for Two Variables Using Tables) Save X brandvalue-View-only Search for tools, help, and more (Alt + Q) File Home Insert Share Page Layout Formulas Edit a copy 12 B > v ... A1 fx Brand A B C D E F G 26 FedEx 27 Ford 28 Fox Other Automotive & Luxury Other 5.8 10 44.3 10.6 34 130 10.2 20 11.7 29 Frito-Lay Consumer Packaged Goods 11.6 6 11.1 Papele 30 cond 30 General El Other 17 34.2 2 132.1 31 Gillette Consumer Packaged Goods 18.3 8 22 32 Goldman Financial Services 6.8 -15 15 41.7 22 33 Google Technology 47 3 41.5 26 43.5 34 Gucci Automotive & Luxury 12.1 12.1 1 4.7 25 35 H&M Other Other 16.1 12 12 18.3 36 Heineken Other 7 7 6 A+ 37 Heinz 37 Heinz Consumer Packaged Goods 5.6 38 Herms Automotive & Luxury 93 20 4.4 45 9.5 20 4.J 40 40 Home Dep Other 39 Hewlett-Pa Technology 15.3 . -16 -10 119.9 10.1 12 12 74.8 41 HSBC 41 HSBC Financial Services 15.2 104.9 42 Hyundai Automotive & Luxury 6.5 21 43 IBM Technology 104.5 104.5 44 IKEA Other 11.5 35.5 45 ING Financial Services 118.7 46 Intel Technology 30.9 53.3 47 J.P. Morga Financial Services 9.1 -30 43.1 9.1 48 John Deere Other 6.4 14 36.2 14 49 Kellogg's Consumer Packaged Goods 8.7 -6 7.1 Lexus Kraft Consumer Packaged Goods Lancome Consumer Packaged Goods Automotive & Luxury 9.1 -10 7.1 6.2 13 4 18.7 L'Oral Consumer Packaged Goods 16.9 16 10.6 54 Louis Vuit Automotive & Luxury 28.4 16 9.4 55 Marlboro Other 16.6 23.6 56 Mastercard Financial Services 7.4 7.4 57 McDonald Other 39.4 88.3 58 Microsoft Technology 56.7 77.8 59 MTV Other 7 5.6 -7 3.1 60 Nestle Consumer Packaged Goods 11.8 18 11.3 61 NIKE Other Other 182 18.2 14 23.7 Hint(s) Check My Work 62 Nintendo Technology 30 26 8 -39 62 Nissan 63 Nissan Automotive & Luxury 17 6.9 17 108.5 64 Nokia 64 Nokia Technology 7 7 - 38.8 65 Pampers Consumer Packaged Goods 9.6 12 12 10.4 104 66 Philips Other 7.1 14 31.9 Question 6 of 10. Submit Assignment for Grading 67 Porsche Automotive & Luxury 5.7 16 17.8 68 Prada Automotive & Luxury 7.1 23 3.4 69 Ralph Lam Other 6.4 28 6.4 =Data brandvalue-View-only Search for tools, help, and more (Alt+Q) File Home Insert Share Page Layout Formulas 12 B A1 fx Brand B Edit a copy D E F G 52 Lexus 51 Lancome Consumer Packaged Goods Automotive & Luxury 53 L'Oral Consumer Packaged Goods 54 Louis Vuit Automotive & Luxury 6.2 13 16.9 28.4 Papele 55 Marlboro Other 16.6 39660 4 1 18.7 16 10.6 16 9.4 23.6 cond 56 Mastercard Financial Services 7.4 8 7.4 57 McDonald Other 39.4 5 88.3 58 Microsoft Technology 56.7 4 77.8 59 MTV Other 5.6 -7 3.1 60 Nestle Consumer Packaged Goods 11.8 18 11.3 61 NIKE Other 18.2 14 23.7 62 Nintendo Technology 8 -39 7.6 63 Nissan Automotive & Luxury 6.9 17 108.5 64 Nokia Technology 7 -55 38.8 65 Pampers Consumer Packaged Goods 9.6 12 10.4 66 Philips Other 7.1 14 31.9 67 Porsche Automotive & Luxury 5.7 16 17.8 68 Prada Automotive & Luxury 7.1 23 3.4 69 Ralph Lau Other 6.4 28 6.4 70 Rolex Automotive & Luxury 7.4 - 14 4.5 71 Santander Financial Services 6 -2 57.3 72 SAP Technology 19.6 73 Siemens Other 13.7 74 Sony Technology 75 Starbucks Other 76 Subway Other 6.6 6.9 6969 28 20.3 1 100.6 -20 69.5 9 13 5.7 17 18.1 77 Thomson Other 78 UPS Other 79 Verizon Other 9.6 10.2 19.3 80 Visa Financial Services 81 Volkswage Automotive & Luxury 82 Wells Farg Financial Services 14.2 8.1 :623219 -10 7.2 13 54.1 0 115.8 12 10.4 16 145.7 -14 91.2 Other 9.4 11 13.5 83 Zara 84 85 86 87 88 89 90
Step by Step Solution
There are 3 Steps involved in it

Get step-by-step solutions from verified subject matter experts