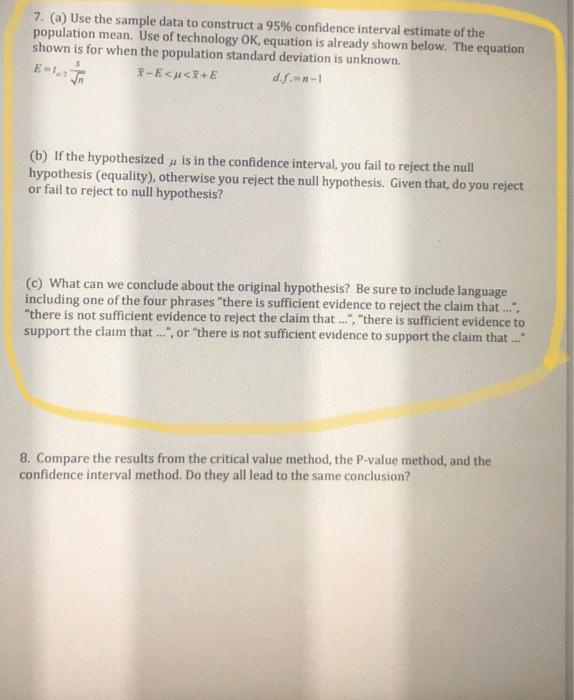
Question: 7. (a) Use the sample data to construct a 95% confidence interval estimate of the population mean. Use of technology OK, equation is already shown

7. (a) Use the sample data to construct a 95%
7. (a) Use the sample data to construct a 95% confidence interval estimate of the population mean. Use of technology OK, equation is already shown below. The equation shown is for when the population standard deviation is unknown. -E.or. and what that indicates. 4. Calculate the test statistict. OK to use technology, but first state the equation that would be used to calculate t when doing a one-population test of mean when the population standard deviation is unknown. 5. Use the critical value method with a 0.05 significance level to test the claim that the mean of the population equals 60 using the following steps: (a) What is a, the area in the excluded tail(s) in #3? (b) Given a and the answer from #3, find the critical value(s) to left-tailed should have a negative answer, right-tailed a positive answer, and two-tailed have two values (+ or - the same number) d.f. =n-1= (c) Draw a graph showing the test statistic, critical value(s), and critical region. t = (d) By comparing tand te, do we "reject" or "fail to reject" the null hypothesis (there are only two choices)? Be clear on your comparison, for instance if right-tailed, t > t would put you in the rejection region and indicate you reject the null hypothesis. (e) What can we conclude about the original hypothesis? Be sure to include language including one of the four phrases "there is sufficient evidence to reject the claim that ..., "there is not sufficient evidence to reject the claim that ... "there is sufficient evidence to support the claim that ...", or "there is not sufficient evidence to support the claim that ... 6. Use the P-value method with a 0.05 significance level to test the claim that the population mean equals 60 using the following steps: (a) What is a, the area in the excluded tail(s) in #3? (b) From the test statistic, find the P-value. If two-tailed, make sure the P-value includes both tails (depending on how you get it, you may or may not need to double the result). P-value = (C) Draw a graph showing the test statistic and P-value (if two-tailed, you will want to show tand-t, so that you can indicate the edges of the two regions that add up to the P-value) (d) By comparing aand P-value, do we "reject" or "fail to reject" the null hypothesis (there are only two choices)? Be clear on your comparison. For example, if P

Step by Step Solution

There are 3 Steps involved in it

1 Expert Approved Answer
Step: 1 Unlock blur-text-image
Question Has Been Solved by an Expert!

Get step-by-step solutions from verified subject matter experts

Step: 2 Unlock
Step: 3 Unlock

Students Have Also Explored These Related General Management Questions!