

Question: 7 . ( A ) Utilizing the data from the David's menu analysis worksheet in previous Question 6 , create a food cost percentage matrix
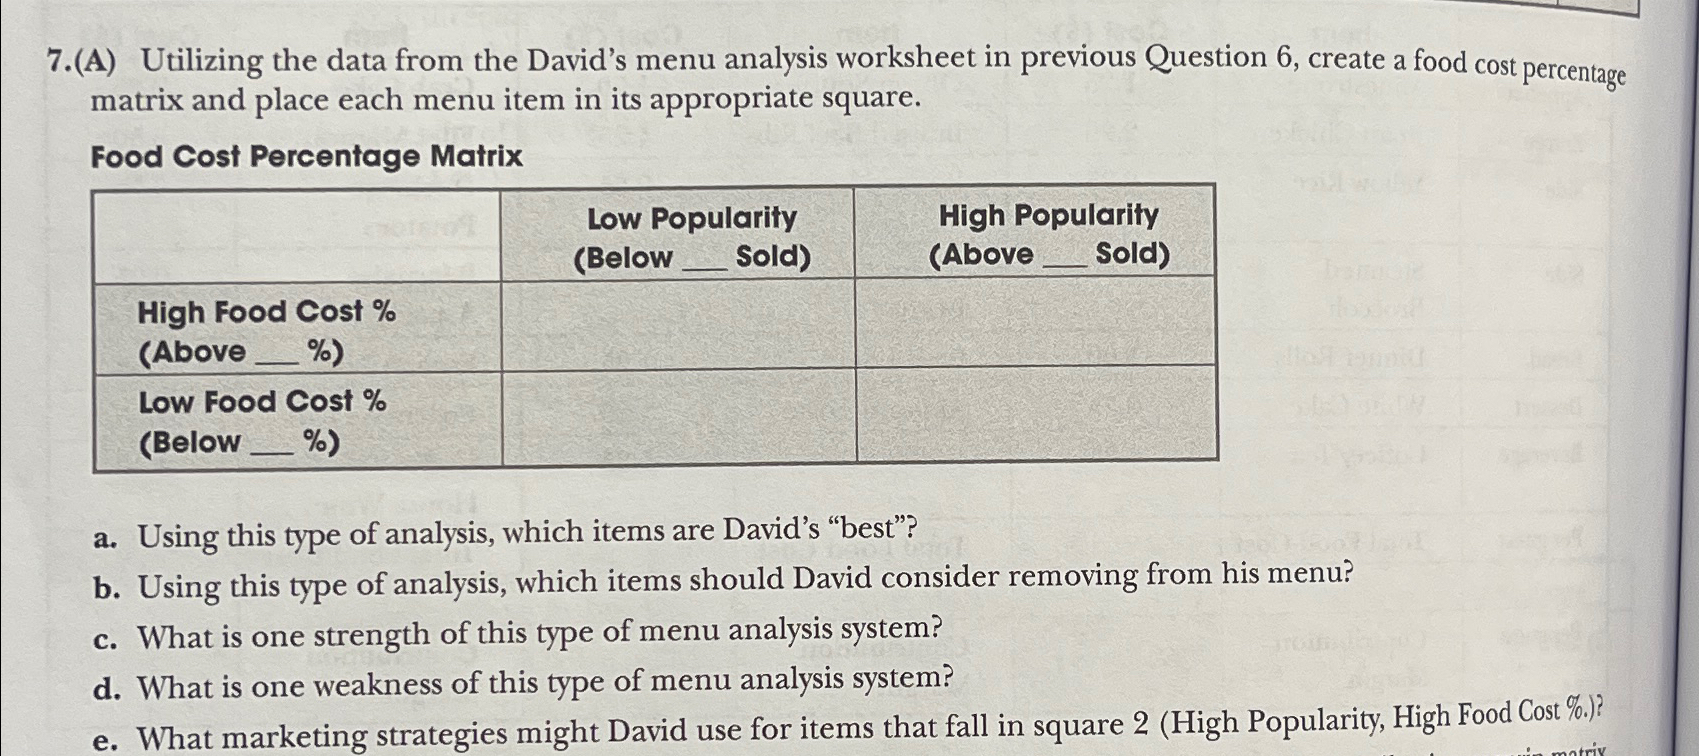
A Utilizing the data from the David's menu analysis worksheet in previous Question create a food cost percentage matrix and place each menu item in its appropriate square.
Food Cost Percentage Matrix
tabletableLow PopularityBelowSoldtableHigh PopularityAboveoldtableHigh Food Cost AbovetableLow Food Cost Below
a Using this type of analysis, which items are David's "best"?
b Using this type of analysis, which items should David consider removing from his menu?
c What is one strength of this type of menu analysis system?
d What is one weakness of this type of menu analysis system?
e What marketing strategies might David use for items that fall in square High Popularity, High Food Cost
Step by Step Solution
There are 3 Steps involved in it
1 Expert Approved Answer
Step: 1 Unlock

Question Has Been Solved by an Expert!
Get step-by-step solutions from verified subject matter experts
Step: 2 Unlock
Step: 3 Unlock