

Question: 7. At a call center, the response time (in seconds) to route a call to an appropriate technical person, is shown below for 30 samples
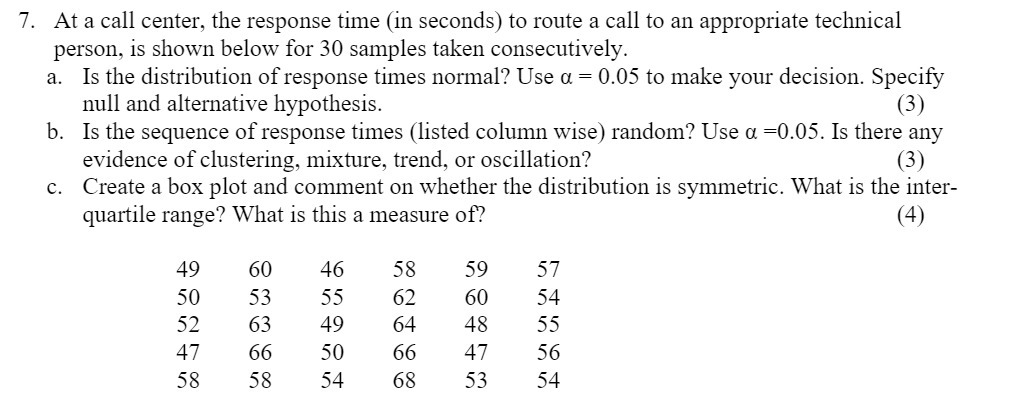
7. At a call center, the response time (in seconds) to route a call to an appropriate technical person, is shown below for 30 samples taken consecutively. a. b. Is the distribution of response times normal? Use (1 = 0.05 to make your decision. Specify null and alternative hypothesis. (3) Is the sequence of response times (listed column wise) random? Use (1 =0.05. Is there any evidence of clustering, mixture, trend, or oscillation? (3) Create a box plot and comment on whether the distribution is symmetric. What is the inter- quartile range? What is this a measure of? (4) 49 60 46 58 59 57 50 53 55 62 6O 54 52 63 49 64 48 55 47 66 50 66 47 56 58 58 54 68 53 54
Step by Step Solution
There are 3 Steps involved in it

Get step-by-step solutions from verified subject matter experts