

Question: 7. Based on this data, answer the following questions: 7a. Does your company have any liquidity problems? Why or why not? Use at least one
7. Based on this data, answer the following questions:
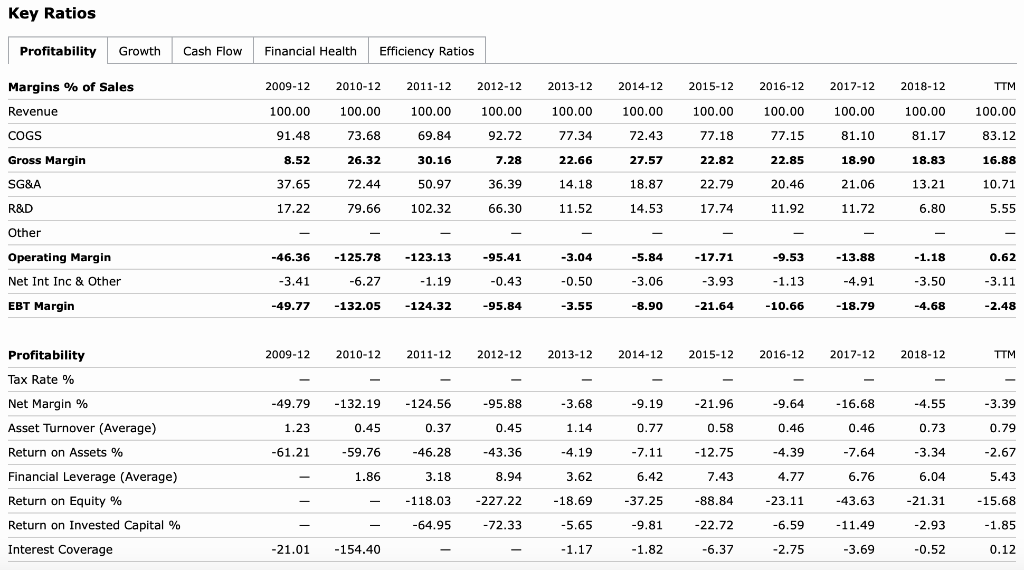
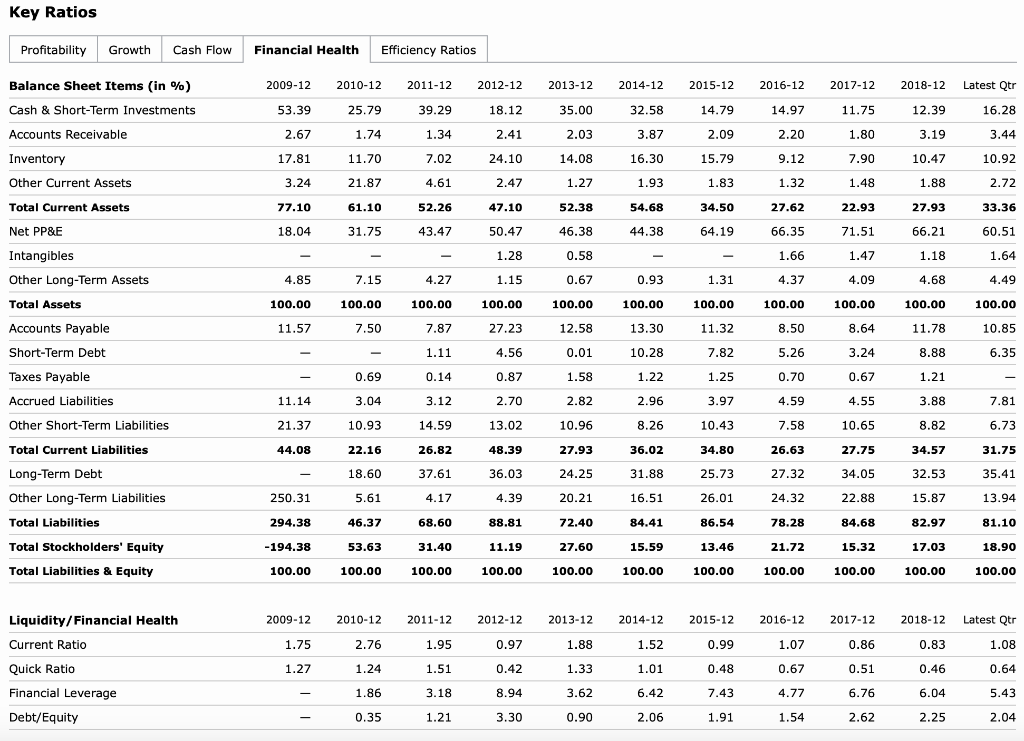
7a. Does your company have any liquidity problems? Why or why not? Use at least one liquidty ratio to justify your answer.
7b. Does your company have any solvency problems? Why or why not? Use at least one debt or leverage ratio to justify your answer.
7c. How well does your company utilize its fixed assets? Use at least one turnover ratio to justify your answer.
7d. How profitable is your company? Use at least one profitability ratio to justify your answer
7e. According to the DuPont Identity, where does the bulk of your companys profitability come from?
Key Ratios Profitability Growth Cash Flow Financial Health Efficiency Ratios Margins % of Sales Revenue COGS 2009-12 100.00 91.48 8.52 37.65 17.22 2010-12 100.00 73.68 26.32 72.44 79.66 2011-12 100.00 69.84 30.16 50.97 102.32 2012-12 100.00 92.72 7.28 36.39 66.30 - -95.41 -0.43 -95.84 2013-12 100.00 77.34 22.66 14.18 11.52 - -3.04 -0.50 -3.55 2014-12 100.00 72.43 27.57 18.87 14.53 2015-12 100.00 77.18 2 2.82 22.79 17.74 2016-12 100.00 77.15 22.85 20.46 11.92 Gross Margin SG&A 2017-12 100.00 81.10 18.90 21.06 11.72 - -13.88 -4.91 -18.79 2018-12 100.00 81.17 18.83 13.21 6.80 - -1.18 -3.50 -4.68 TTM 100.00 83.12 16.88 10.71 5.55 R&D Other - Operating Margin 0.62 Net Int Inc & Other -46.36 -3.41 -49.77 -125.78 -6.27 -132.05 -123.13 -1.19 -124.32 -5.84 -3.06 -8.90 -17.71 -3.93 -21.64 -9.53 -1.13 - 10.66 -3.11 -2.48 EBT Margin 2009-12 2010-12 2011-12 2012-12 2013-12 2014-12 2015-12 2016-12 2017-12 2018-12 TTM Profitability Tax Rate % Net Margin % Asset Turnover (Average) -49.79 1.23 -61.21 - Return on Assets % Financial Leverage (Average) Return on Equity % Return on Invested Capital % Interest Coverage -132.19 -124.56 0.45 0.37 -59.76 -46.28 1.863 .18 - -118.03 - -64.95 -154.40 - -95.88 0.45 -43.36 8.94 -227.22 -72.33 - -3.68 -9.19 1.14 0.77 -4.19 -7.11 3.626.42 -18.69 -37.25 -5.65 -9.81 - 1.17 -1.82 -21.96 -9.64 0.58 0.46 -12.75 -4.39 7.434 .77 -88.84 -23.11 -22.72 -6.59 -6.37 -2.75 - 16.68 0.46 -7.64 6.76 -43.63 -11.49 -3.69 -4.55 0.73 -3.34 6.04 -21.31 -2.93 -0.52 -3.39 0.79 -2.67 5.43 -15.68 -1.85 0.12 -21.01 Key Ratios Profitability Growth Cash Flow Financial Health Efficiency Ratios Balance Sheet Items (in %) Cash & Short-Term Investments Accounts Receivable Inventory Other Current Assets Total Current Assets Net PP&E 2014-12 32.58 3.87 16.30 1.93 54.68 44.38 - 0.93 100.00 13.30 10.28 1.22 2.96 2009-12 2010-12 2011-12 53.39 25.79 39.29 2.67 1.74 1.34 17.81 11.70 7.02 3.24 21.87 4.61 77.10 61.10 52.26 18.04 31.75 43.47 - 4.85 7.154.27 100.00 100.00 100.00 11.577.50 7.87 - - 1.11 - 0.69 0.14 11.14 3.04 3.12 21.37 10.93 14.59 44.08 22.16 26.82 18.60 37.61 250.31 5.61 4.17 294.38 46.37 68.60 -194.38 53.63 31.40 100.00 100.00 100.00 2015-12 14.79 2.09 15.79 1.83 34.50 64.19 - 1.31 100.00 11.32 7.82 1.25 3.97 Intangibles 2012-12 2013-12 18.12 35.00 2.412 .03 24.10 14.08 2 .47 1.27 47.10 52.38 50.47 46.38 1.28 0.58 1.150 .67 100.00 100.00 27.23 12.58 4.56 0.01 0.87 1.58 2.70 2.82 13.02 10.96 48.39 27.93 36.03 24.25 4.39 20.21 88.81 72.40 11.19 27.60 100.00 100.00 Other Long-Term Assets Total Assets 2017-12 11.75 1.80 7.90 1.48 22.93 71.51 1.47 4.09 100.00 8.64 3.24 0.67 Accounts Payable 2016-12 14.97 2.20 9 .12 1.32 27.62 66.35 1.66 4.37 100.00 8.50 5 .26 0.70 4.59 7.58 26.63 27.32 24.32 78.28 21.72 100.00 2018-12 Latest Qtr 12.39 16.28 3.193 .44 10.47 10.92 1.88 2.72 27.93 33.36 66.21 60.51 1.18 1.64 4.68 4.49 100.00 100.00 11.78 10.85 8.88 6.35 1.21 3.88 7.81 8.82 6.73 34.57 31.75 32.53 35.41 15.87 13.94 82.97 81.10 17.03 18.90 100.00 100.00 Short-Term Debt 4.55 8.26 10.43 10.65 36.02 34.80 Taxes Payable Accrued Liabilities Other Short-Term Liabilities Total Current Liabilities Long-Term Debt Other Long-Term Liabilities Total Liabilities Total Stockholders' Equity Total Liabilities & Equity 31.88 16.51 84.41 15.59 100.00 25.73 26.01 86.54 13.46 100.00 27.75 34.05 22.88 84.68 15.32 100.00 Liquidity/Financial Health Current Ratio Quick Ratio Financial Leverage Debt/Equity 2009-12 1.75 1.27 - - 2010-12 2011-12 2.76 1.95 1.24 1.51 1.863 .18 0.35 1.21 2012-12 0.97 0.42 8.94 3.30 2013-12 1.88 1.33 3.62 0.90 2014-12 1.52 1.01 6.42 2.06 2015-12 2016-12 2017-12 0.99 1.07 0.86 0.48 0.67 0.51 7.434.776 .76 1.91 1.54 2.62 2018-12 0.83 0.46 6.04 2.25 Latest Qtr 1.08 0.64 5.43 2.04
Step by Step Solution
There are 3 Steps involved in it

Get step-by-step solutions from verified subject matter experts