

Question: 7. Chapter ma2pe09r, Section .16, Problem 018 (ID: 018.16.MANK09) Figure 16-1 Graph (a) Graph (b) Graph (c) Graph (d) PRICE PRICE PRICE PRICE QUANTITY QUANTITY

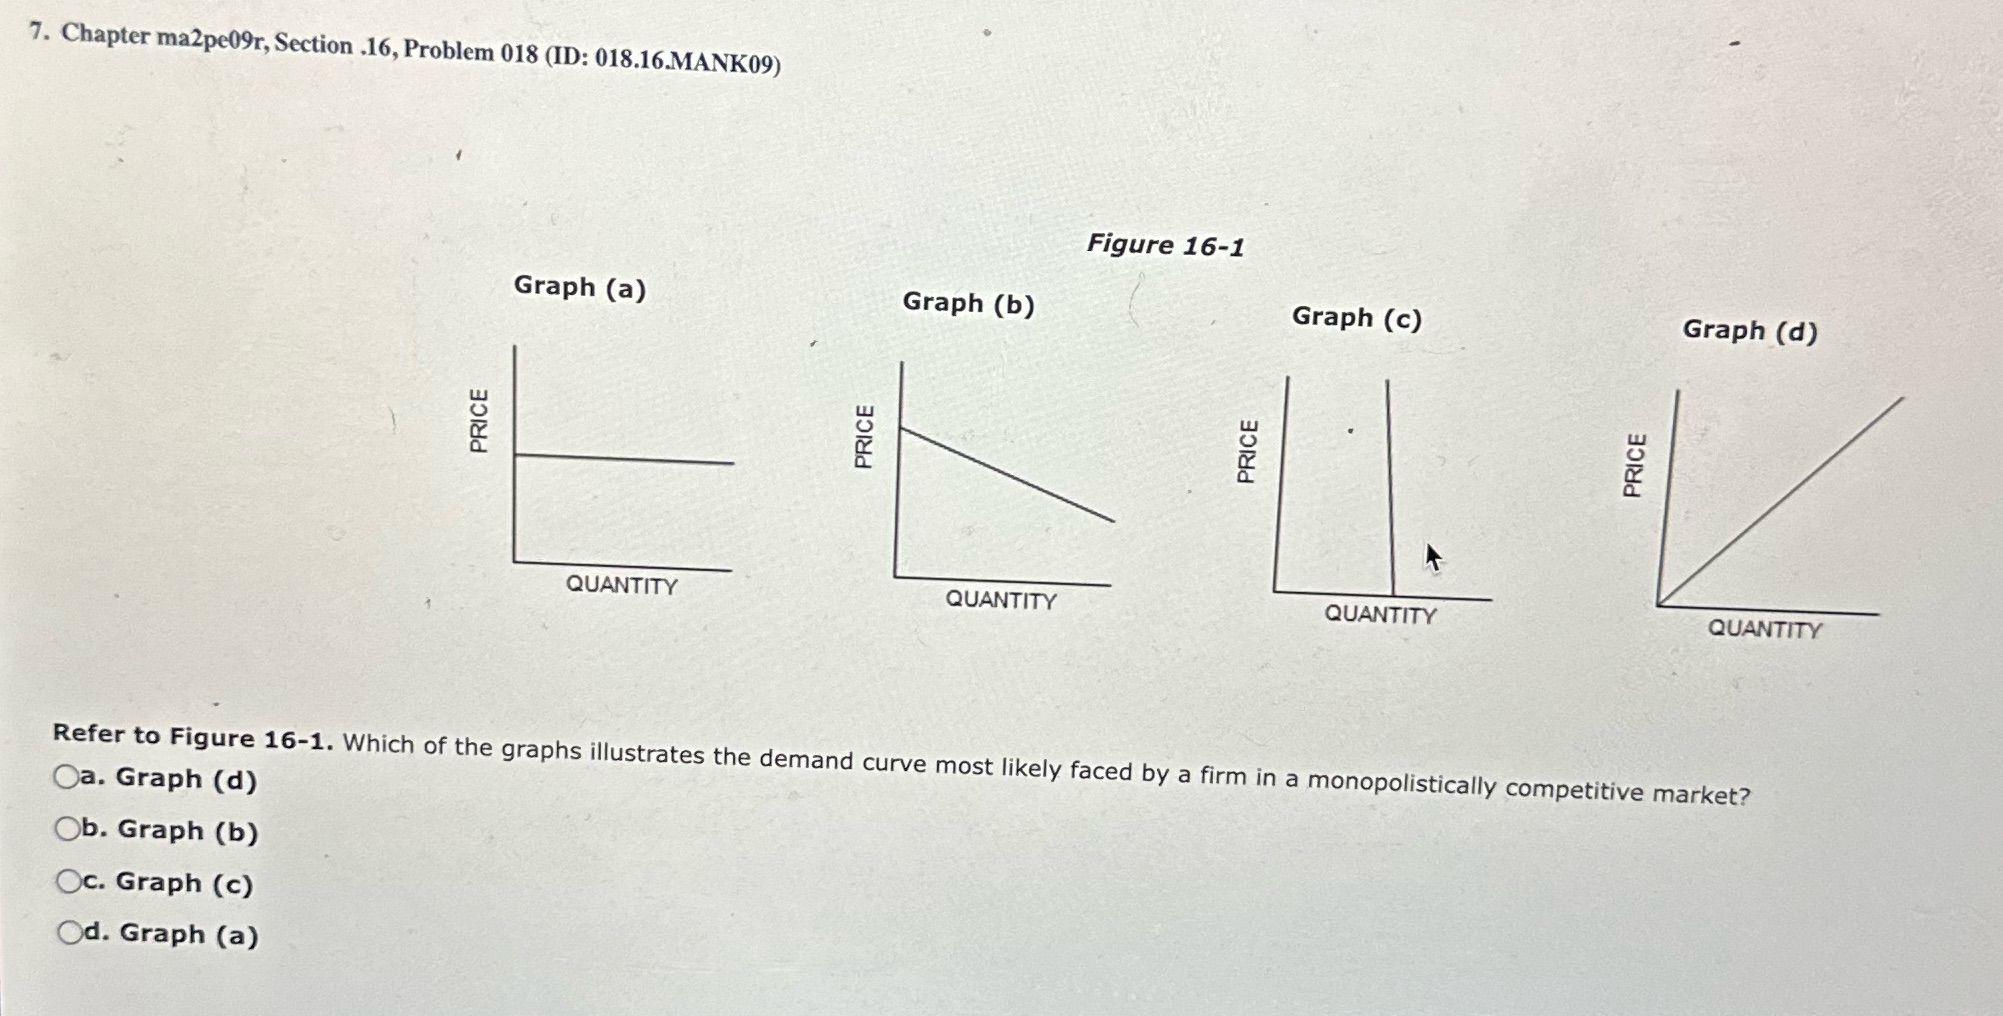
7. Chapter ma2pe09r, Section .16, Problem 018 (ID: 018.16.MANK09) Figure 16-1 Graph (a) Graph (b) Graph (c) Graph (d) PRICE PRICE PRICE PRICE QUANTITY QUANTITY QUANTITY QUANTITY Refer to Figure 16-1. Which of the graphs illustrates the demand curve most likely faced by a firm in a monopolistically competitive market? Oa. Graph (d) Ob. Graph (b) Oc. Graph (c) Od. Graph (a)
Step by Step Solution
There are 3 Steps involved in it
1 Expert Approved Answer
Step: 1 Unlock

Question Has Been Solved by an Expert!
Get step-by-step solutions from verified subject matter experts
Step: 2 Unlock
Step: 3 Unlock