

Question: 7. Compare the stock prices produced by the two methods (i.e. comparables method and DFCF method) to the actual stock price. Explain to your boss
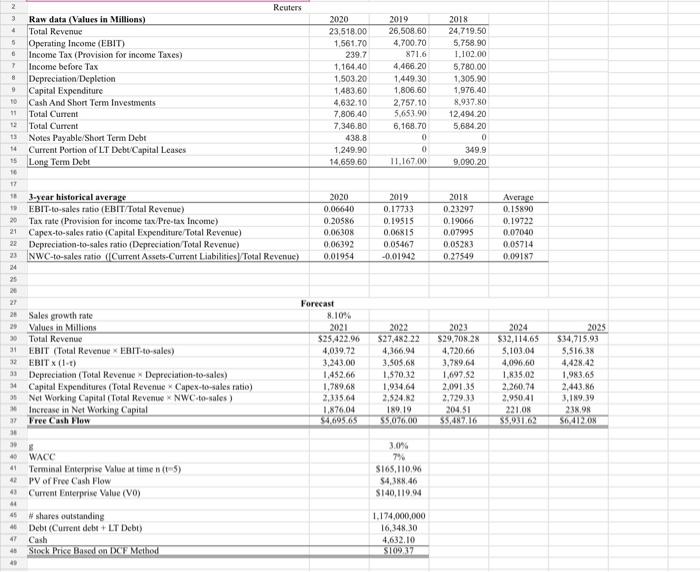
7. Compare the stock prices produced by the two methods (i.e. comparables method and DFCF method) to the actual stock price. Explain to your boss why the estimates from the two valuation methods may differ from the actual. Specifically address the assumptions implicit in the models themselves as well as the assumptions you made in preparing your analysis. For example, how reliable are the growth rates used in the assumptions? . 0 8 2018 24.719.50 5,758.90 1.102.00 5,780.00 1,305.90 1,976,40 8.937.80 12,494.20 5,684,20 0 349.9 9.090.20 2018 0.23297 0.19066 0.07995 0.05283 0.27549 Average 0.15890 0.19722 0.07040 005714 0.09187 2 Reuters 3 Raw data (Values in Millions) 2020 2019 Total Revenue 23,518.00 26,508.60 5 Operating Income (EBIT) 1.561.70 4.700.70 Income Tax (Provision for income Taxes) 239.7 871.6 7 Income before Tax 1.164.40 4,466.20 Depreciation Depletion 1,503.20 1,449.30 9 Capital Expenditure 1,483.60 1,808.60 10 Cash And Short Term Investments 4,632.10 2,757.10 11 Total Current 7,806 40 5,653.90 Total Current 7,346.80 6,168.70 15 Notes Payable/Short Term Debt 438.8 0 14 Current Portion of LT Debt Capital Leases 1,249.90 0 15 Long Term Debt 14,659.60 11.167.00 10 17 183-year historical average 2020 2019 19 EBIT-to-sales ratio (EBIT/Total Revenue) 0.06640 0.17733 20 Tax rate (Provision for income tax Pre-tax Income) 0.20586 0.19515 21 Capex-to-sales ratio (Capital Expenditure Total Revenue) 0.06308 0,06815 22 Depreciation-to-sales ratio (Depreciation Total Revenue) 0.06392 0.05467 NWC-to-sales ratio (Current Assets Current Liabilities Total Revenue) 0.01954 -0.01942 24 25 20 27 Forecast 28 Sales growth rate 8.10% 29 Values in Millions 2021 2022 30 Total Revenue $25,422.96 $27,482 22 31 EBIT (Total Revenue EBIT-to-sales) 4.039.72 4,366.94 33 EBITX (1-1) 3.243.00 3.505.68 33 Depreciation (Total Revenue Depreciation-to-sales) 1.452.66 1,570,32 14 Capital Expenditures (Total Revenue * Capex-to-sales ratio) 1,789.6 1,934.64 35 Not Working Capital (Total Revenue NWC-to-sales) 2.335.64 2.524.82 Increase in Net Working Capital 1,876.04 189.19 32 Free Cash Flow $4.695.65 $5.076.00 30 39 8 3.0% 40 WACC 7% 41 Terminal Enterprise Value at time n(t) S165,110,96 42 PV of Free Cash Flow $4,388.46 4 Current Enterprise Value (VO) S140,119.94 45 #shares outstanding 1.174,000,000 46 Debt (Current debt +LT Debt) 16,348.30 Cash 4,632.10 Stock Price Based on DC Method S10937 2023 $29,708.28 4.720.66 3,789.64 1,697.52 2,091.35 2.729.33 204.51 35.487.16 2024 $32.114.65 5.103.04 4,096,60 1.835,02 2.260.74 2.950.41 221 ON $5.931.62 2025 $34,715.93 5.516,38 4.428.42 1,983.65 2,443.86 3.1N9.39 238.98 56,4120 42 7. Compare the stock prices produced by the two methods (i.e. comparables method and DFCF method) to the actual stock price. Explain to your boss why the estimates from the two valuation methods may differ from the actual. Specifically address the assumptions implicit in the models themselves as well as the assumptions you made in preparing your analysis. For example, how reliable are the growth rates used in the assumptions? . 0 8 2018 24.719.50 5,758.90 1.102.00 5,780.00 1,305.90 1,976,40 8.937.80 12,494.20 5,684,20 0 349.9 9.090.20 2018 0.23297 0.19066 0.07995 0.05283 0.27549 Average 0.15890 0.19722 0.07040 005714 0.09187 2 Reuters 3 Raw data (Values in Millions) 2020 2019 Total Revenue 23,518.00 26,508.60 5 Operating Income (EBIT) 1.561.70 4.700.70 Income Tax (Provision for income Taxes) 239.7 871.6 7 Income before Tax 1.164.40 4,466.20 Depreciation Depletion 1,503.20 1,449.30 9 Capital Expenditure 1,483.60 1,808.60 10 Cash And Short Term Investments 4,632.10 2,757.10 11 Total Current 7,806 40 5,653.90 Total Current 7,346.80 6,168.70 15 Notes Payable/Short Term Debt 438.8 0 14 Current Portion of LT Debt Capital Leases 1,249.90 0 15 Long Term Debt 14,659.60 11.167.00 10 17 183-year historical average 2020 2019 19 EBIT-to-sales ratio (EBIT/Total Revenue) 0.06640 0.17733 20 Tax rate (Provision for income tax Pre-tax Income) 0.20586 0.19515 21 Capex-to-sales ratio (Capital Expenditure Total Revenue) 0.06308 0,06815 22 Depreciation-to-sales ratio (Depreciation Total Revenue) 0.06392 0.05467 NWC-to-sales ratio (Current Assets Current Liabilities Total Revenue) 0.01954 -0.01942 24 25 20 27 Forecast 28 Sales growth rate 8.10% 29 Values in Millions 2021 2022 30 Total Revenue $25,422.96 $27,482 22 31 EBIT (Total Revenue EBIT-to-sales) 4.039.72 4,366.94 33 EBITX (1-1) 3.243.00 3.505.68 33 Depreciation (Total Revenue Depreciation-to-sales) 1.452.66 1,570,32 14 Capital Expenditures (Total Revenue * Capex-to-sales ratio) 1,789.6 1,934.64 35 Not Working Capital (Total Revenue NWC-to-sales) 2.335.64 2.524.82 Increase in Net Working Capital 1,876.04 189.19 32 Free Cash Flow $4.695.65 $5.076.00 30 39 8 3.0% 40 WACC 7% 41 Terminal Enterprise Value at time n(t) S165,110,96 42 PV of Free Cash Flow $4,388.46 4 Current Enterprise Value (VO) S140,119.94 45 #shares outstanding 1.174,000,000 46 Debt (Current debt +LT Debt) 16,348.30 Cash 4,632.10 Stock Price Based on DC Method S10937 2023 $29,708.28 4.720.66 3,789.64 1,697.52 2,091.35 2.729.33 204.51 35.487.16 2024 $32.114.65 5.103.04 4,096,60 1.835,02 2.260.74 2.950.41 221 ON $5.931.62 2025 $34,715.93 5.516,38 4.428.42 1,983.65 2,443.86 3.1N9.39 238.98 56,4120 42
Step by Step Solution
There are 3 Steps involved in it

Get step-by-step solutions from verified subject matter experts