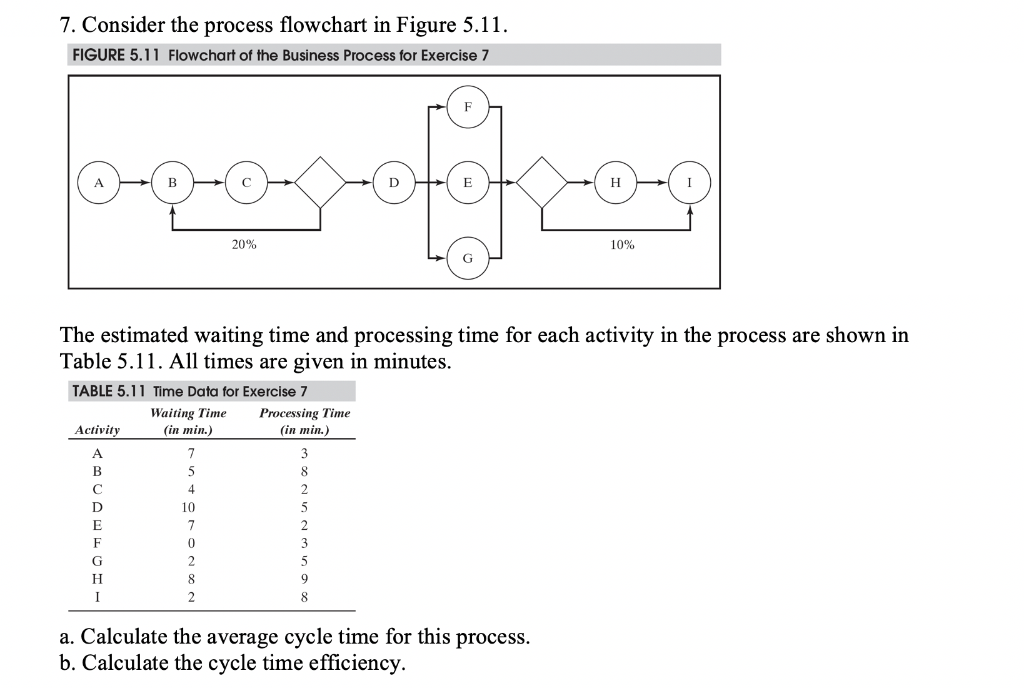
Question: 7. Consider the process flowchart in Figure 5.11. FIGURE 5.11 Flowchart of the Business Process for Exercise 7 F A B D E H 20%

7. Consider the process flowchart in Figure 5.11.

7. Consider the process flowchart in Figure 5.11. FIGURE 5.11 Flowchart of the Business Process for Exercise 7 F A B D E H 20% 10% The estimated waiting time and processing time for each activity in the process are shown in Table 5.11. All times are given in minutes. TABLE 5.11 Time Data for Exercise 7 Waiting Time Processing Time Activity (in min.) (in min.) A B 5 4 10 7 D E F G H 1 8 2 5 2 3 5 0 2 8 9 8 a. Calculate the average cycle time for this process. b. Calculate the cycle time efficiency

Step by Step Solution

There are 3 Steps involved in it

1 Expert Approved Answer
Step: 1 Unlock blur-text-image
Question Has Been Solved by an Expert!

Get step-by-step solutions from verified subject matter experts

Step: 2 Unlock
Step: 3 Unlock

Students Have Also Explored These Related General Management Questions!