

Question: 7. EXIT Thinking Critically and Solving Problems Food Spending and Percent of Income Which conclusion is supported by the graph? Spent on Food 16,000 35
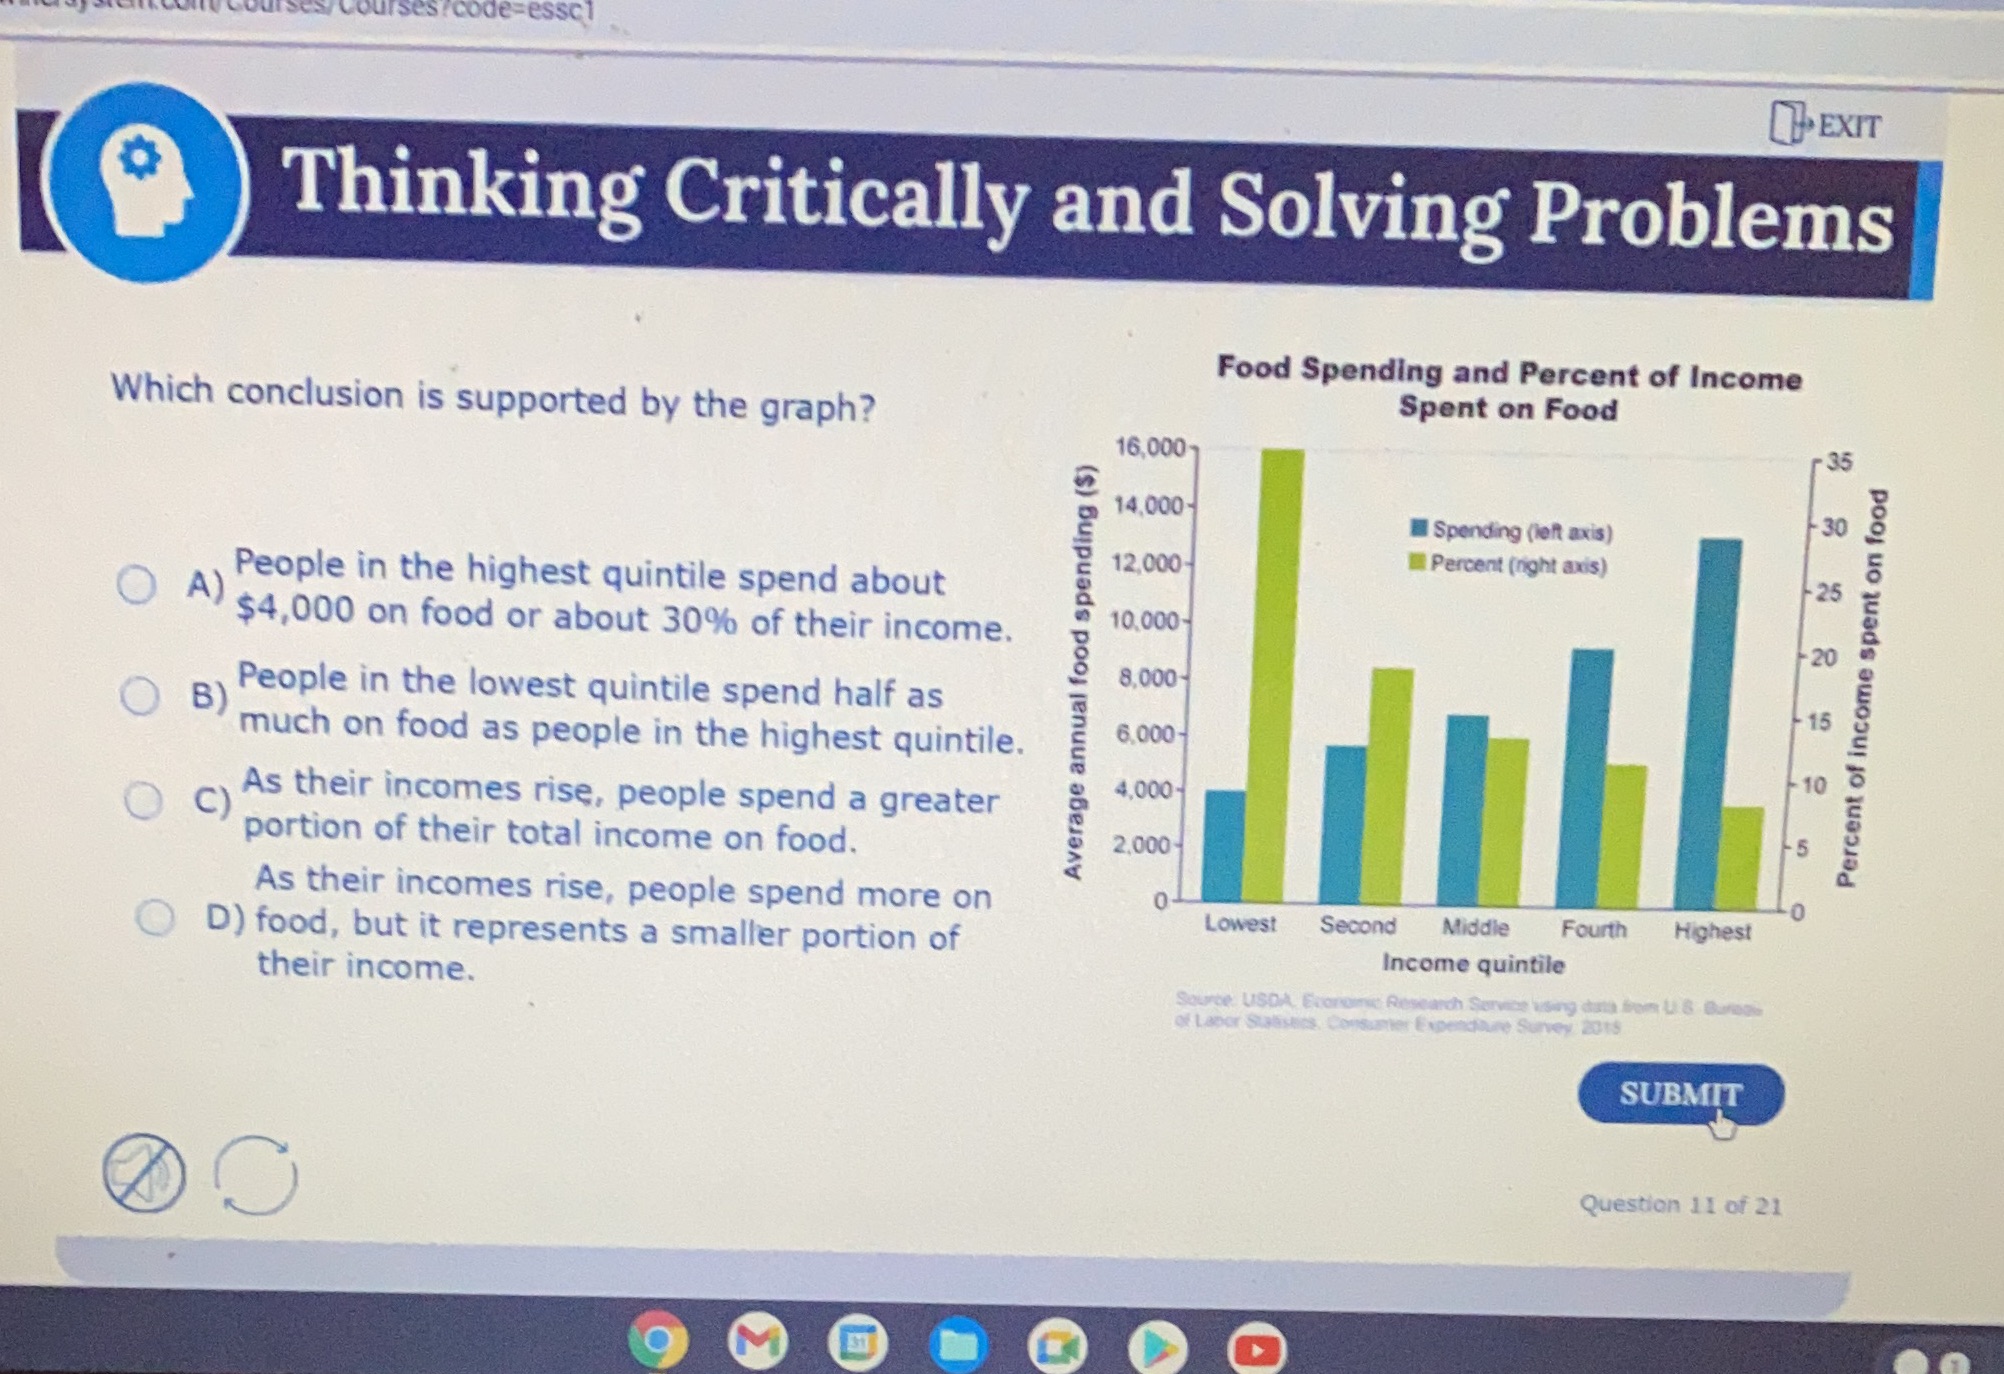
7. EXIT Thinking Critically and Solving Problems Food Spending and Percent of Income Which conclusion is supported by the graph? Spent on Food 16,000 35 14,000- Spending (left axis) - 30 12,000 Percent (right axis) People in the highest quintile spend about -25 ( A) $4,000 on food or about 30% of their income. 10.000- -20 Average annual food spending ($) 8,000 Percent of income spent on food ( B) People in the lowest quintile spend half as -15 much on food as people in the highest quintile. 6,000 -10 ) As their incomes rise, people spend a greater 4.000 portion of their total income on food. 2.000 -5 As their incomes rise, people spend more on ( D) food, but it represents a smaller portion of Lowest Second Middle Fourth Highest Income quintile their income. Source USDA. Evorome Research Service using data from U 8 Bureau of Lapor Statistics, Consumer Expendoure Survey 2018 SUBMIT Question 11 of 21 9 M Q Q C O
Step by Step Solution
There are 3 Steps involved in it

Get step-by-step solutions from verified subject matter experts