

Question: 7. Given this scatter graph: Height vs age in months in children Age Months a. What is the best fit line? X y x (2)
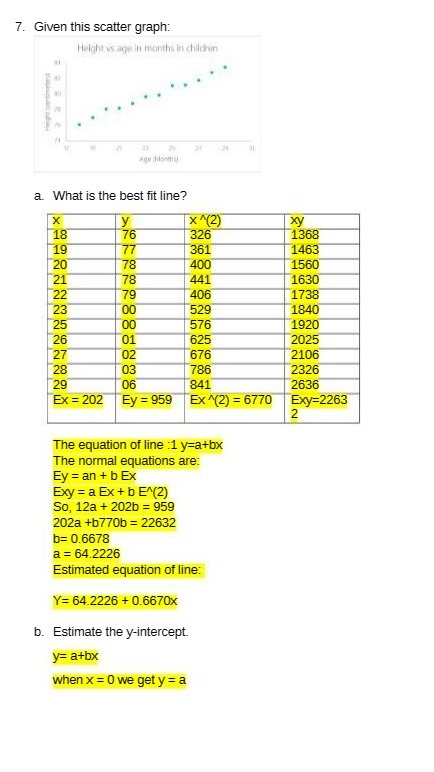
7. Given this scatter graph: Height vs age in months in children Age Months a. What is the best fit line? X y x (2) xy 18 76 326 1368 19 77 361 1463 20 78 400 1560 21 78 441 1630 22 79 406 1738 23 00 529 1840 25 00 576 1920 26 01 625 2025 27 02 676 2106 28 03 786 2326 29 06 841 2636 Ex = 202 Ey = 959 Ex ^(2) = 6770 Exy=2263 2 The equation of line :1 y=a+bx The normal equations are: Ey = an + b Ex Exy = a Ex + b E^(2) So, 12a + 202b = 959 202a +b770b = 22632 b= 0.6678 a = 64.2226 Estimated equation of line: Y= 64.2226 + 0.6670x b. Estimate the y-intercept. y= atbx when x = 0 we get y = a
Step by Step Solution
There are 3 Steps involved in it
1 Expert Approved Answer
Step: 1 Unlock

Question Has Been Solved by an Expert!
Get step-by-step solutions from verified subject matter experts
Step: 2 Unlock
Step: 3 Unlock