

Question: 7. In cells P3 through P9 in the table above, insert Sparklines. B. In merged cells D17-E17, is there any trend in the data based
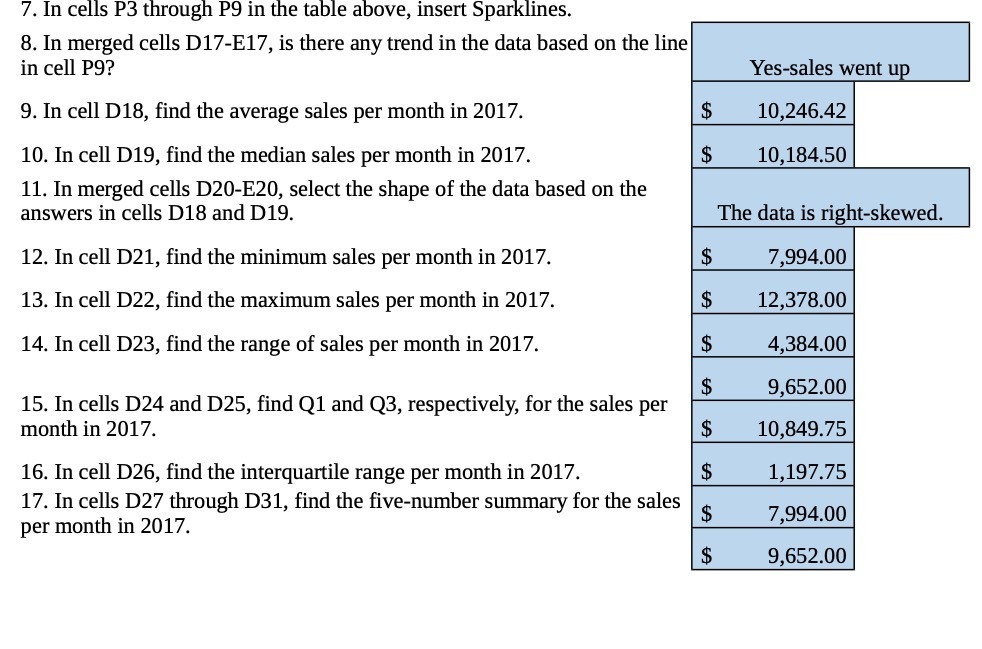
7. In cells P3 through P9 in the table above, insert Sparklines. B. In merged cells D17-E17, is there any trend in the data based on the line in cell P9? 9. In cell D18, find the average sales per month in 2017. 10. In cell D19, find the median sales per month in 2017. 11. In merged cells D20-E20, select the shape of the data based on the answers in cells D18 and D19. 12. In cell D21, find the minimum sales per month in 2017. 13. In cell D22, find the maximum sales per month in 2017. 14. In cell D23, find the range of sales per month in 2017. 15. In cells D24 and D25, find Q1 and Q3, respectively, for the sales per month in 2017. 16. In cell D26, find the interquartile range per month in 2017. 17. In cells D27 through D31, find the ve-number summary for the sales per month in 2017
Step by Step Solution
There are 3 Steps involved in it

Get step-by-step solutions from verified subject matter experts