

Question: 7. In the chapter, you learned about many metrics that can be used to evaluate forecast accuracy. The MAPE was one of those that may
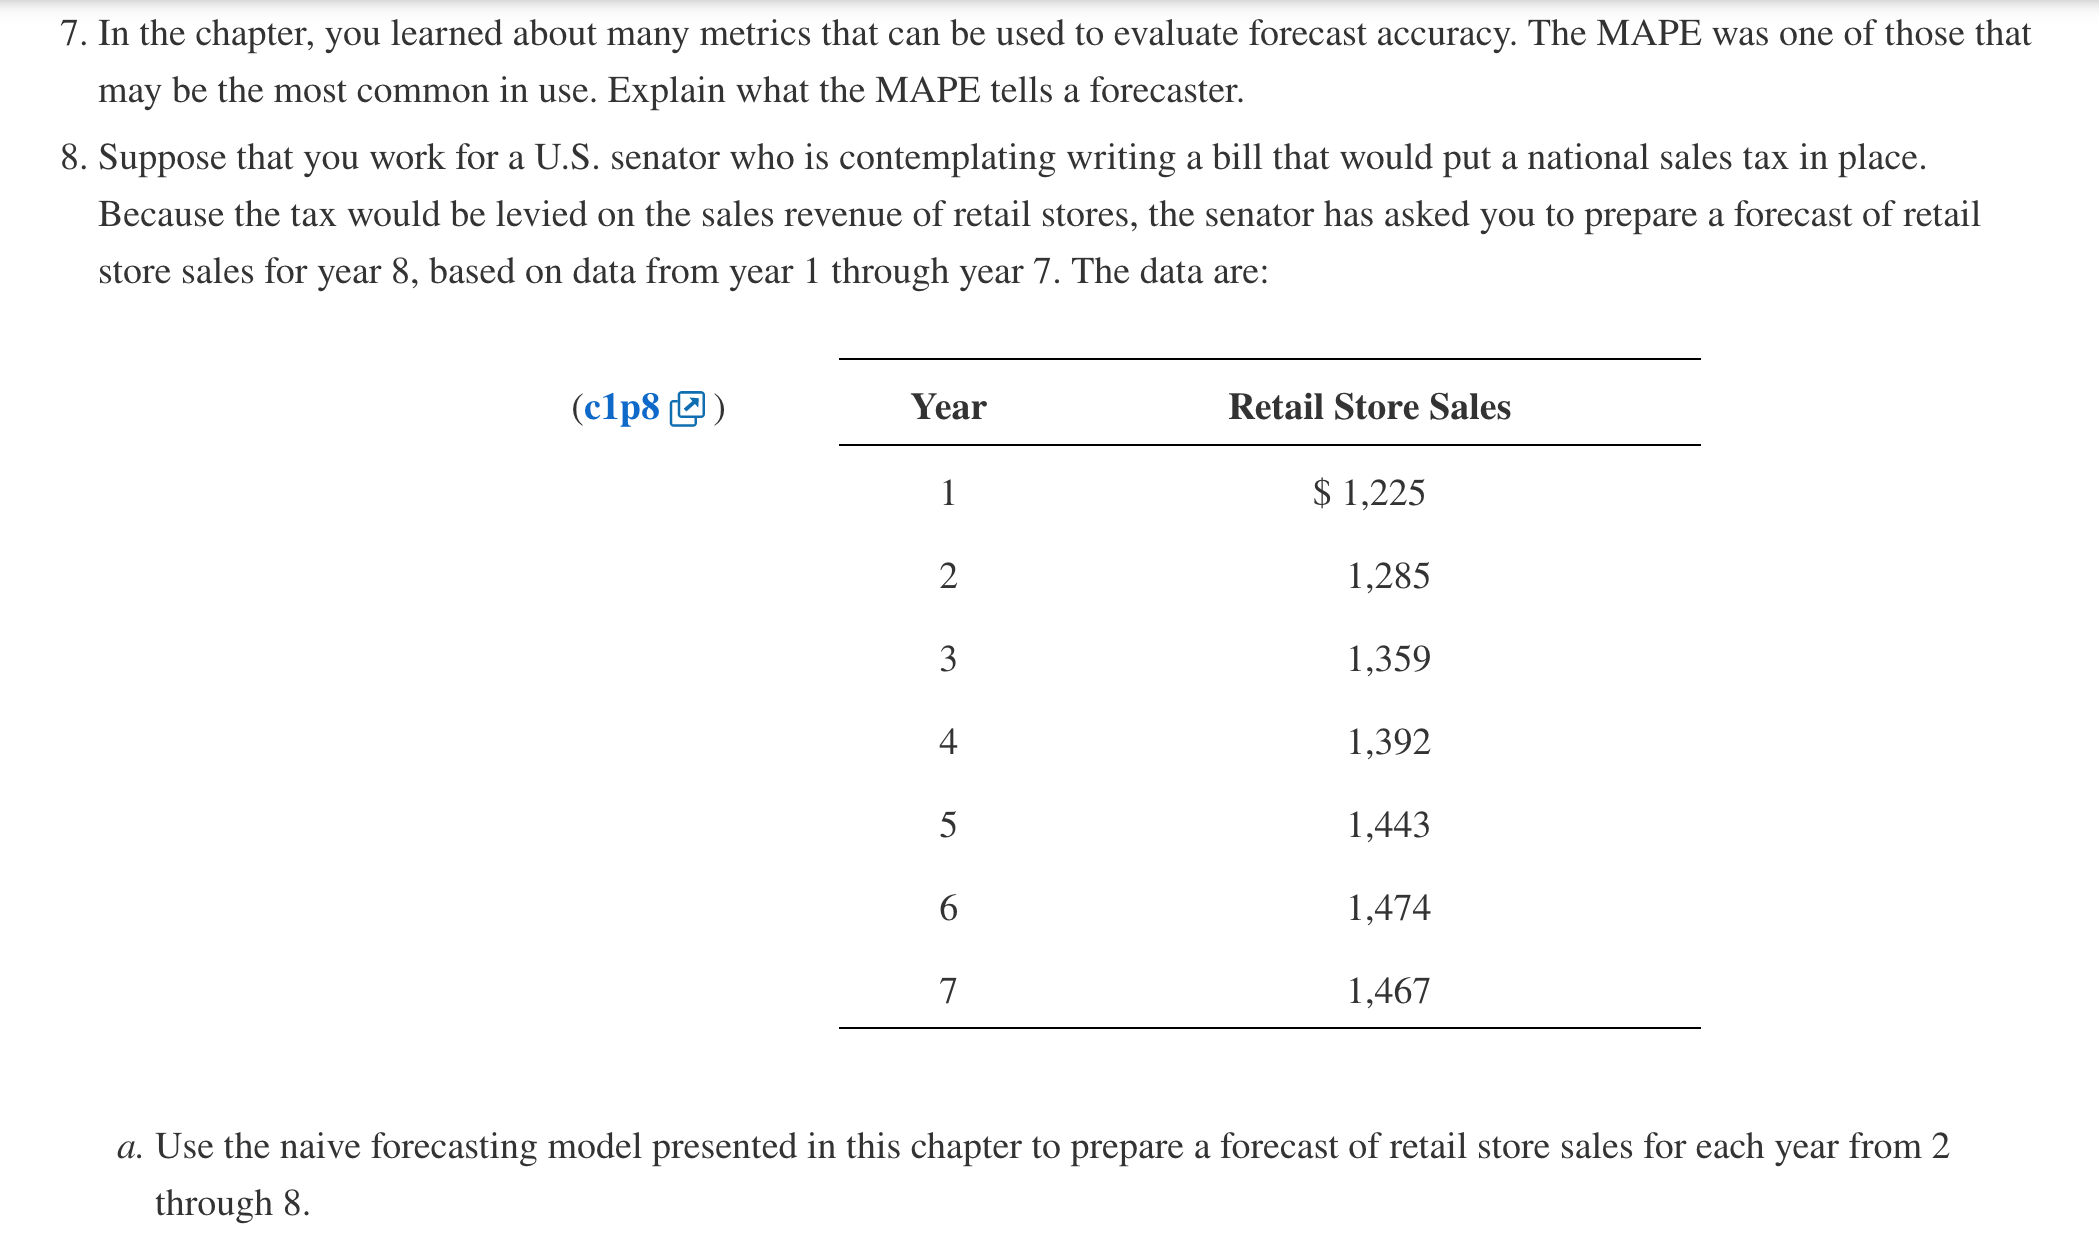
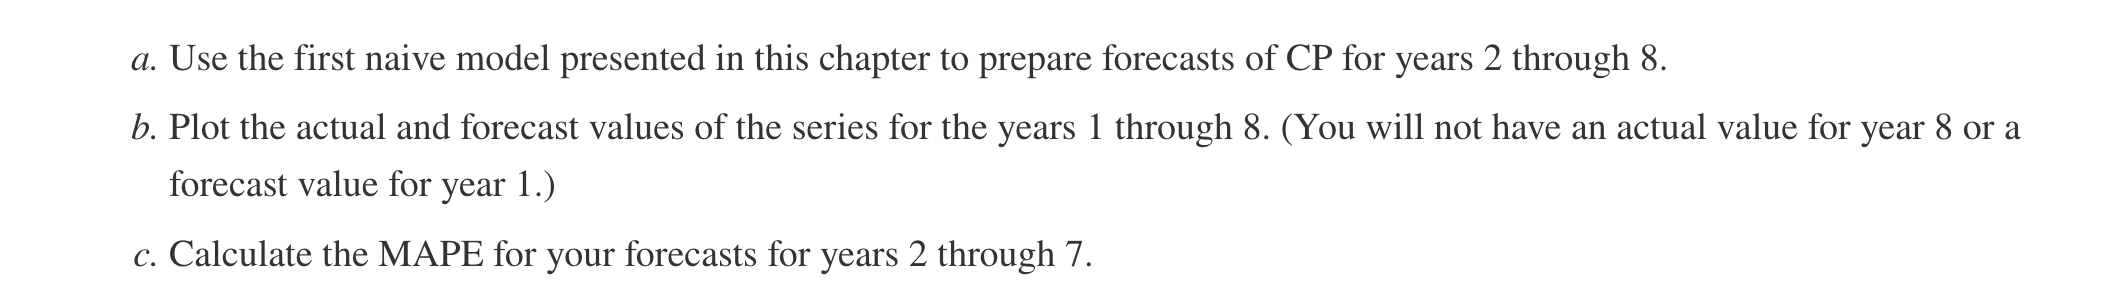
7. In the chapter, you learned about many metrics that can be used to evaluate forecast accuracy. The MAPE was one of those that may be the most common in use. Explain what the MAPE tells a forecaster. 8. Suppose that you work for a U.S. senator who is contemplating writing a bill that would put a national sales tax in place. Because the tax would be levied on the sales revenue of retail stores, the senator has asked you to prepare a forecast of retail store sales for year 8, based on data from year 1 through year 7. The data are: a (clp8 ) Year Retail Store Sales 1 $ 1,225 2 1,285 3 1,359 4 1,392 5 1,443 6 1,474 7 1,467 a. Use the naive forecasting model presented in this chapter to prepare a forecast of retail store sales for each year from 2 through 8. b. Prepare a time-series graph of the actual and forecast values of retail store sales for the entire period. (You will not have a forecast for year 1 or an actual value for year 8.) c. Calculate the MAPE for your forecast series using the values for year 2 through year 7. 9. Suppose that you work for a major U.S. retail department store that has outlets nationwide. The store offers credit to customers in various forms, including store credit cards, and over the years has seen a substantial increase in credit purchases. The manager of credit sales is concerned about the degree to which consumers are using credit and has started to track the ratio of consumer installment credit to personal income. She calls this ratio the credit percent, or CP, and has asked that you forecast that series for year 8. The available data are: (clp9 @) Year CP 1 12.96 2 14.31 3 15.34 4 15.49 5 15.70 6 16.00 7 15.62 a. Use the first naive model presented in this chapter to prepare forecasts of CP for years 2 through 8. b. Plot the actual and forecast values of the series for the years 1 through 8. (You will not have an actual value for year 8 or a forecast value for year 1.) c. Calculate the MAPE for your forecasts for years 2 through 7. 7. In the chapter, you learned about many metrics that can be used to evaluate forecast accuracy. The MAPE was one of those that may be the most common in use. Explain what the MAPE tells a forecaster. 8. Suppose that you work for a U.S. senator who is contemplating writing a bill that would put a national sales tax in place. Because the tax would be levied on the sales revenue of retail stores, the senator has asked you to prepare a forecast of retail store sales for year 8, based on data from year 1 through year 7. The data are: a (clp8 ) Year Retail Store Sales 1 $ 1,225 2 1,285 3 1,359 4 1,392 5 1,443 6 1,474 7 1,467 a. Use the naive forecasting model presented in this chapter to prepare a forecast of retail store sales for each year from 2 through 8. b. Prepare a time-series graph of the actual and forecast values of retail store sales for the entire period. (You will not have a forecast for year 1 or an actual value for year 8.) c. Calculate the MAPE for your forecast series using the values for year 2 through year 7. 9. Suppose that you work for a major U.S. retail department store that has outlets nationwide. The store offers credit to customers in various forms, including store credit cards, and over the years has seen a substantial increase in credit purchases. The manager of credit sales is concerned about the degree to which consumers are using credit and has started to track the ratio of consumer installment credit to personal income. She calls this ratio the credit percent, or CP, and has asked that you forecast that series for year 8. The available data are: (clp9 @) Year CP 1 12.96 2 14.31 3 15.34 4 15.49 5 15.70 6 16.00 7 15.62 a. Use the first naive model presented in this chapter to prepare forecasts of CP for years 2 through 8. b. Plot the actual and forecast values of the series for the years 1 through 8. (You will not have an actual value for year 8 or a forecast value for year 1.) c. Calculate the MAPE for your forecasts for years 2 through 7
Step by Step Solution
There are 3 Steps involved in it

Get step-by-step solutions from verified subject matter experts