

Question: 7. In this exercise, you will investigate the relationship between a worker's age and earnings. (Generally, older workers have more job experience, leading to higher
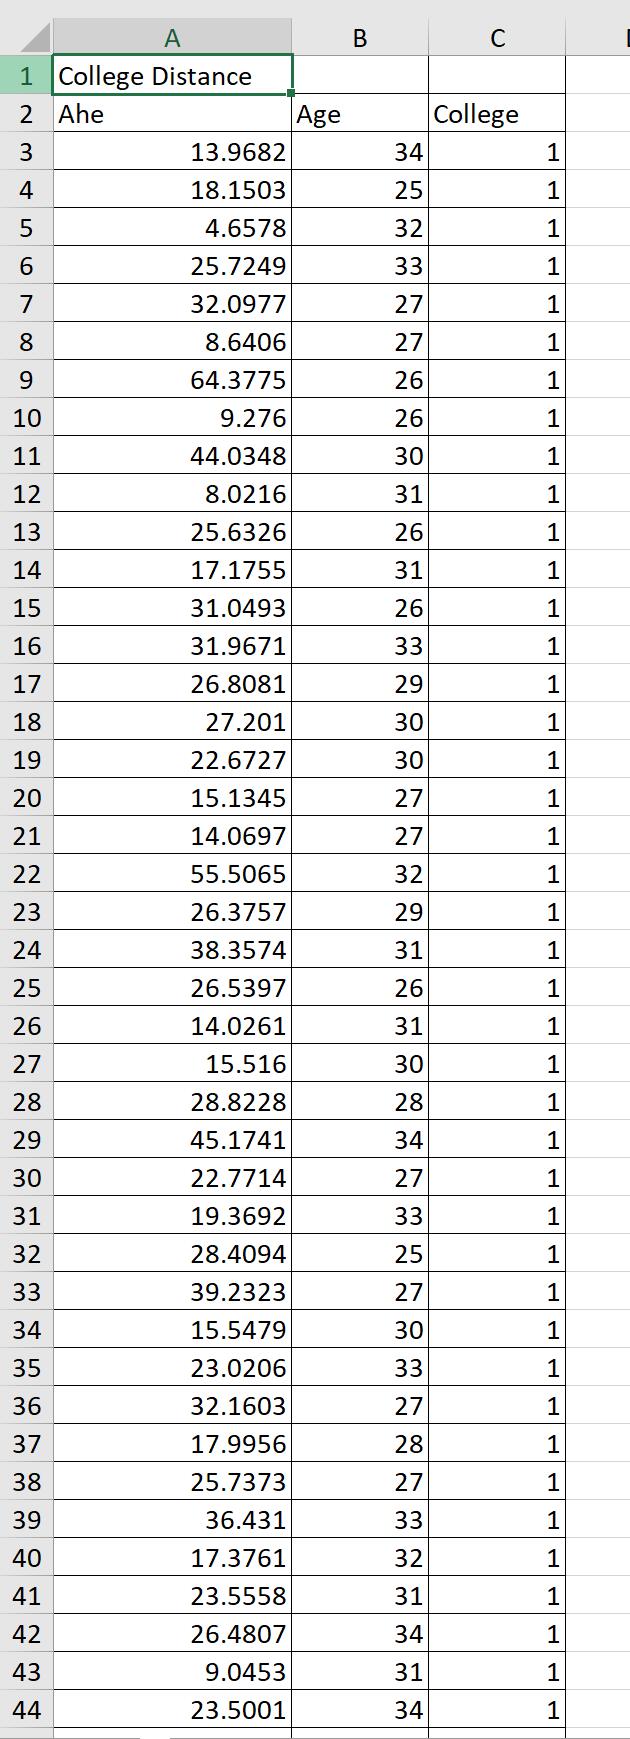
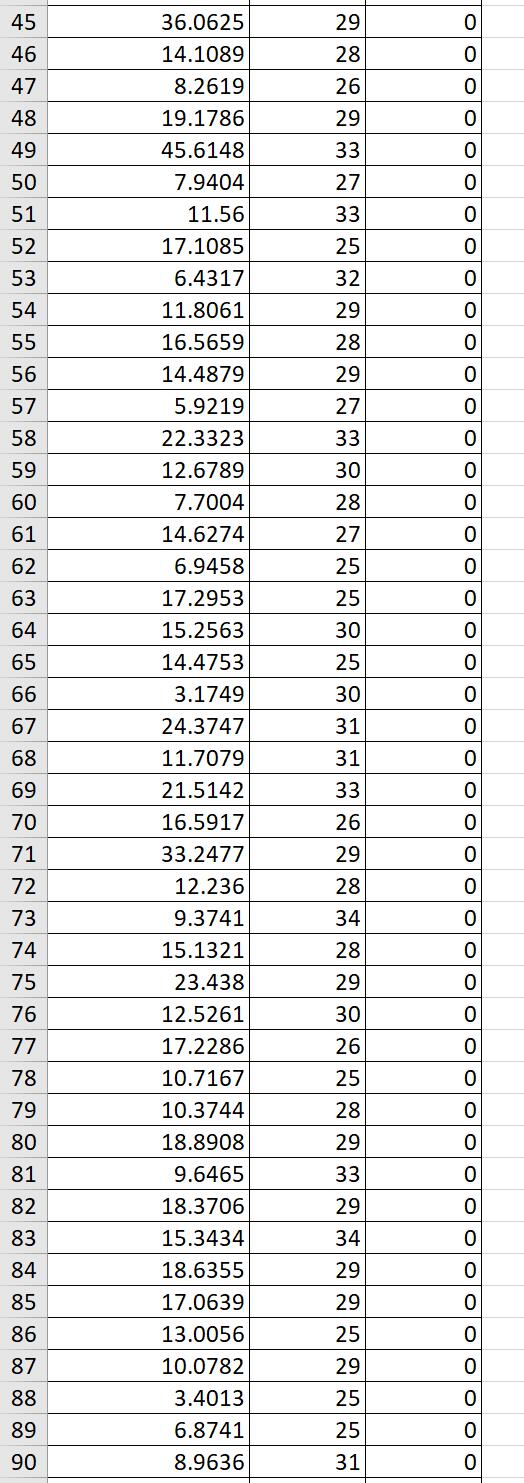
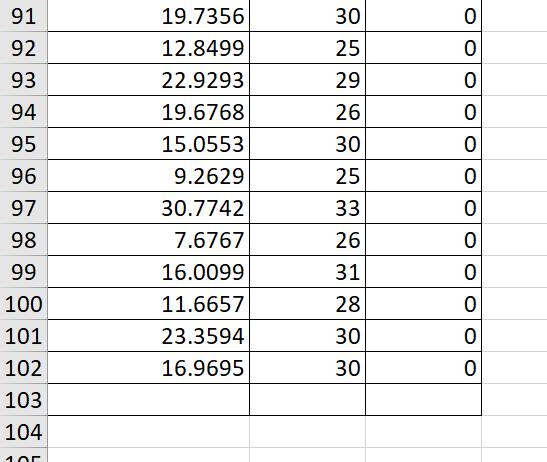
7. In this exercise, you will investigate the relationship between a worker's age and earnings. (Generally, older workers have more job experience, leading to higher productivity and earnings.) The following table contains data for full-time, full-years workers, age 25-34, with a high school diploma or B.A./B.S. as their highest degree. Download the data from the table by clicking the download table icon . A detailed description of the variables used in the data set is available here 1. Use a statistical package of your choice to answer the following questions. Suppose you are interested in estimating the following model Ahe =o +1Age + u Run a regression of average hourly earnings (AHE) on age (Age). What is the estimated intercept 0? The estimated intercept E0 is - 1.5361 (Round your response to four decimal places) What is the estimated slope 21 ? The estimated slope E1 is 0.7214 (Round your response to four decimal places) The estimated model is Ahe = 1.5372 + 0.7215Age, R2: 0032 (0.400) Where the number in parentheses is the homoskedastic standard error for the regression coefcient 31 . Suppose you wanted to test the hypothesis that 1 equals zero at the 1%, 5% and 10% level. That is, H0:1 =0 vs. H1:1 #0 Report the tstatistic and pvalue for this test. The tstatistic is 1.804 (Round your response to three decimal places) The pvalue is 0.071 (Round your response to three decimal places) Can you reject the null hypothesis at the 5% significance level? ::'..'A. No. a] B. Yes. Construct a 95% condence interval for the slope coefficient 1 . The 95% condence interval for the slope coefficient 1 is [ - 0.0625 , 1.5055 ] (Round your response to three decimal places) Now, suppose you are interested in estimating the following model for the subpopulation of high school graduates (college = 0) Ahe =0 +1Age +u Run a regression of average hourly earnings (AHE) on age (Age) using the sample for which the indicator variable college = 0. What is the estimated intercept 230? The estimated intercept 30 is - 11.945 (Round your response to four decimal places) What is the estimated slope 231 ? The estimated slope 31 is 0.9520 (Round your response to four decimal places) The estimated model is Ahe = 11.9439 + 0.9520Age, R2: 0.103 (0.375) Where the number in parentheses is the homoskedastic standard error for the regression coefcient 1 . Using the sample of high school graduates, suppose you wanted to test the hypothesis that m equals zero at the 5% signicance level. That is, H021 =0 VS. H1210 Report the tstatistic and pvalue for this test. The tstatistic is 2.539 (Round your response to three decimal places) The pvalue is 0.011 (Round your response to three decimal places) Can you reject the null hypothesis at the 5% significance level? C'A. Yes. .th B. No. Now, suppose you are interested in estimating the following model for the subpopulation of college graduates (college = 1) Ahe =0 +1Age +u Run a regression of average hourly earnings (AHE) on age (Age) using the sample for which the indicator variable college = 1. What is the estimated intercept ZED? The estimated intercept g is 28.5765 (Round your response to four decimal places) What is the estimated slope E1 ? 2/3 The estimated slope 1 is 0.1196 (Round your response to four decimal places) The estimated model is Ahe = 28.5780 + 0.1196Age, R2: 0.001 (0.692) Where the number in parentheses is the homoskedastic standard error for the regression coefcient 1 . Using the sample of college graduates, suppose you wanted to test the hypothesis that 1 equals zero at the 5% signicance level. That is, Hoi1 =0 VS. H1I10 Report the tstatistic and pvalue for this test. The tstatistic is 0.173 (Round your response to three decimal places) The pvalue is 0.863 (Round your response to three decimal places) Can you reject the null hypothesis at the 5% significance level? (jg-VA. No. {:23 B. Yes. Is the effect of age on earnings different from high school graduates that for college graduates? In other words, can we reject the following hypothesis at a reasonable signicance level? . college _ high school _ . college _ high school Ho.1 1 0vs.H1.1 1 #0 Use the following formula to report the tstatistic and pvalue for this test. = SEA 2 + SE _ 2 1 , college [2'1 , high school The tstatistic is Acollege Ahigh school SE [ 1 1 ] (Round your response to three decimal places) The pvalue is (Round your response to three decimal places) 3/3 \f\f\f
Step by Step Solution
There are 3 Steps involved in it

Get step-by-step solutions from verified subject matter experts