

Question: 7, Interpret the values from the below Excel graph. SUMMARY OUTPUT Regression Statistics Multiple R 0.989778267 R Square 0.979661017 Adjusted R Square 0.969491525 Standard Error
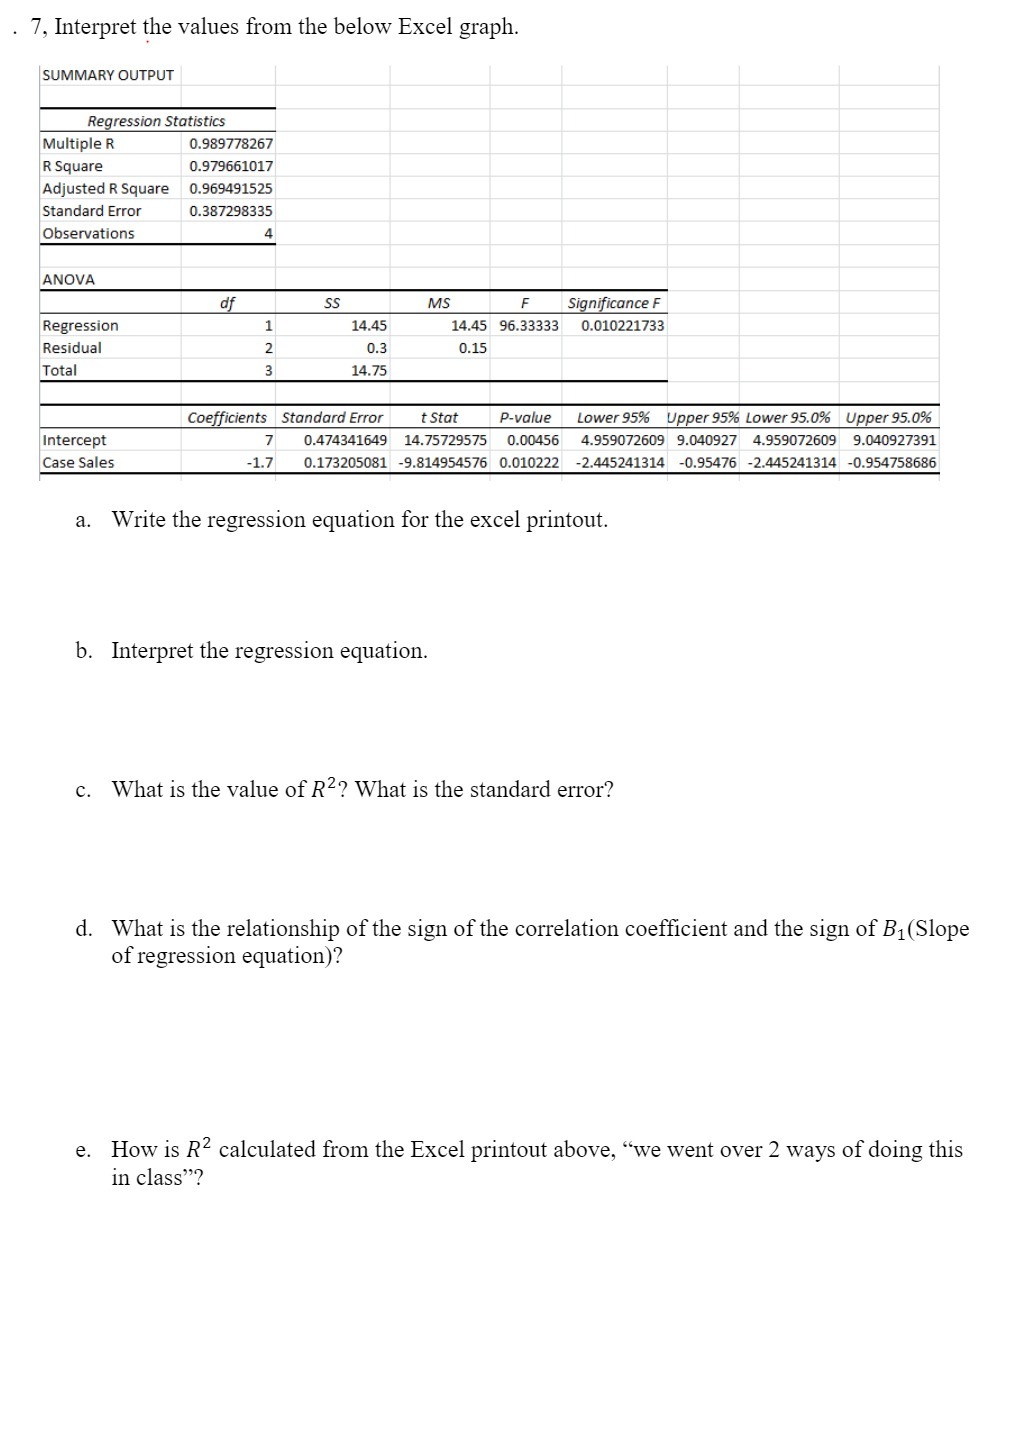
7, Interpret the values from the below Excel graph. SUMMARY OUTPUT Regression Statistics Multiple R 0.989778267 R Square 0.979661017 Adjusted R Square 0.969491525 Standard Error 0.387298335 Observations ANOVA SS MS F Significance F Regression W N H 14.45 14.45 96.33333 0.010221733 Residual 0.3 0.15 Total 14.75 Coefficients Standard Error Stat P-value Lower 95% Upper 95% Lower 95.0% Upper 95.0% Intercept 7 0.474341649 14.75729575 0.00456 4.959072609 9.040927 4.959072609 9.040927391 Case Sales -1.7 0.173205081 -9.814954576 0.010222 -2.445241314 -0.95476 -2.445241314 -0.954758686 Write the regression equation for the excel printout. b. Interpret the regression equation. c. What is the value of R2? What is the standard error? d. What is the relationship of the sign of the correlation coefficient and the sign of B1(Slope of regression equation)? e. How is R2 calculated from the Excel printout above, "we went over 2 ways of doing this in class"
Step by Step Solution
There are 3 Steps involved in it

Get step-by-step solutions from verified subject matter experts