

Question: 7. Listed below are results from two different tests designed to measure achievement. (x)TestB 64 48 51 59 60 43 41 42 35 50 45
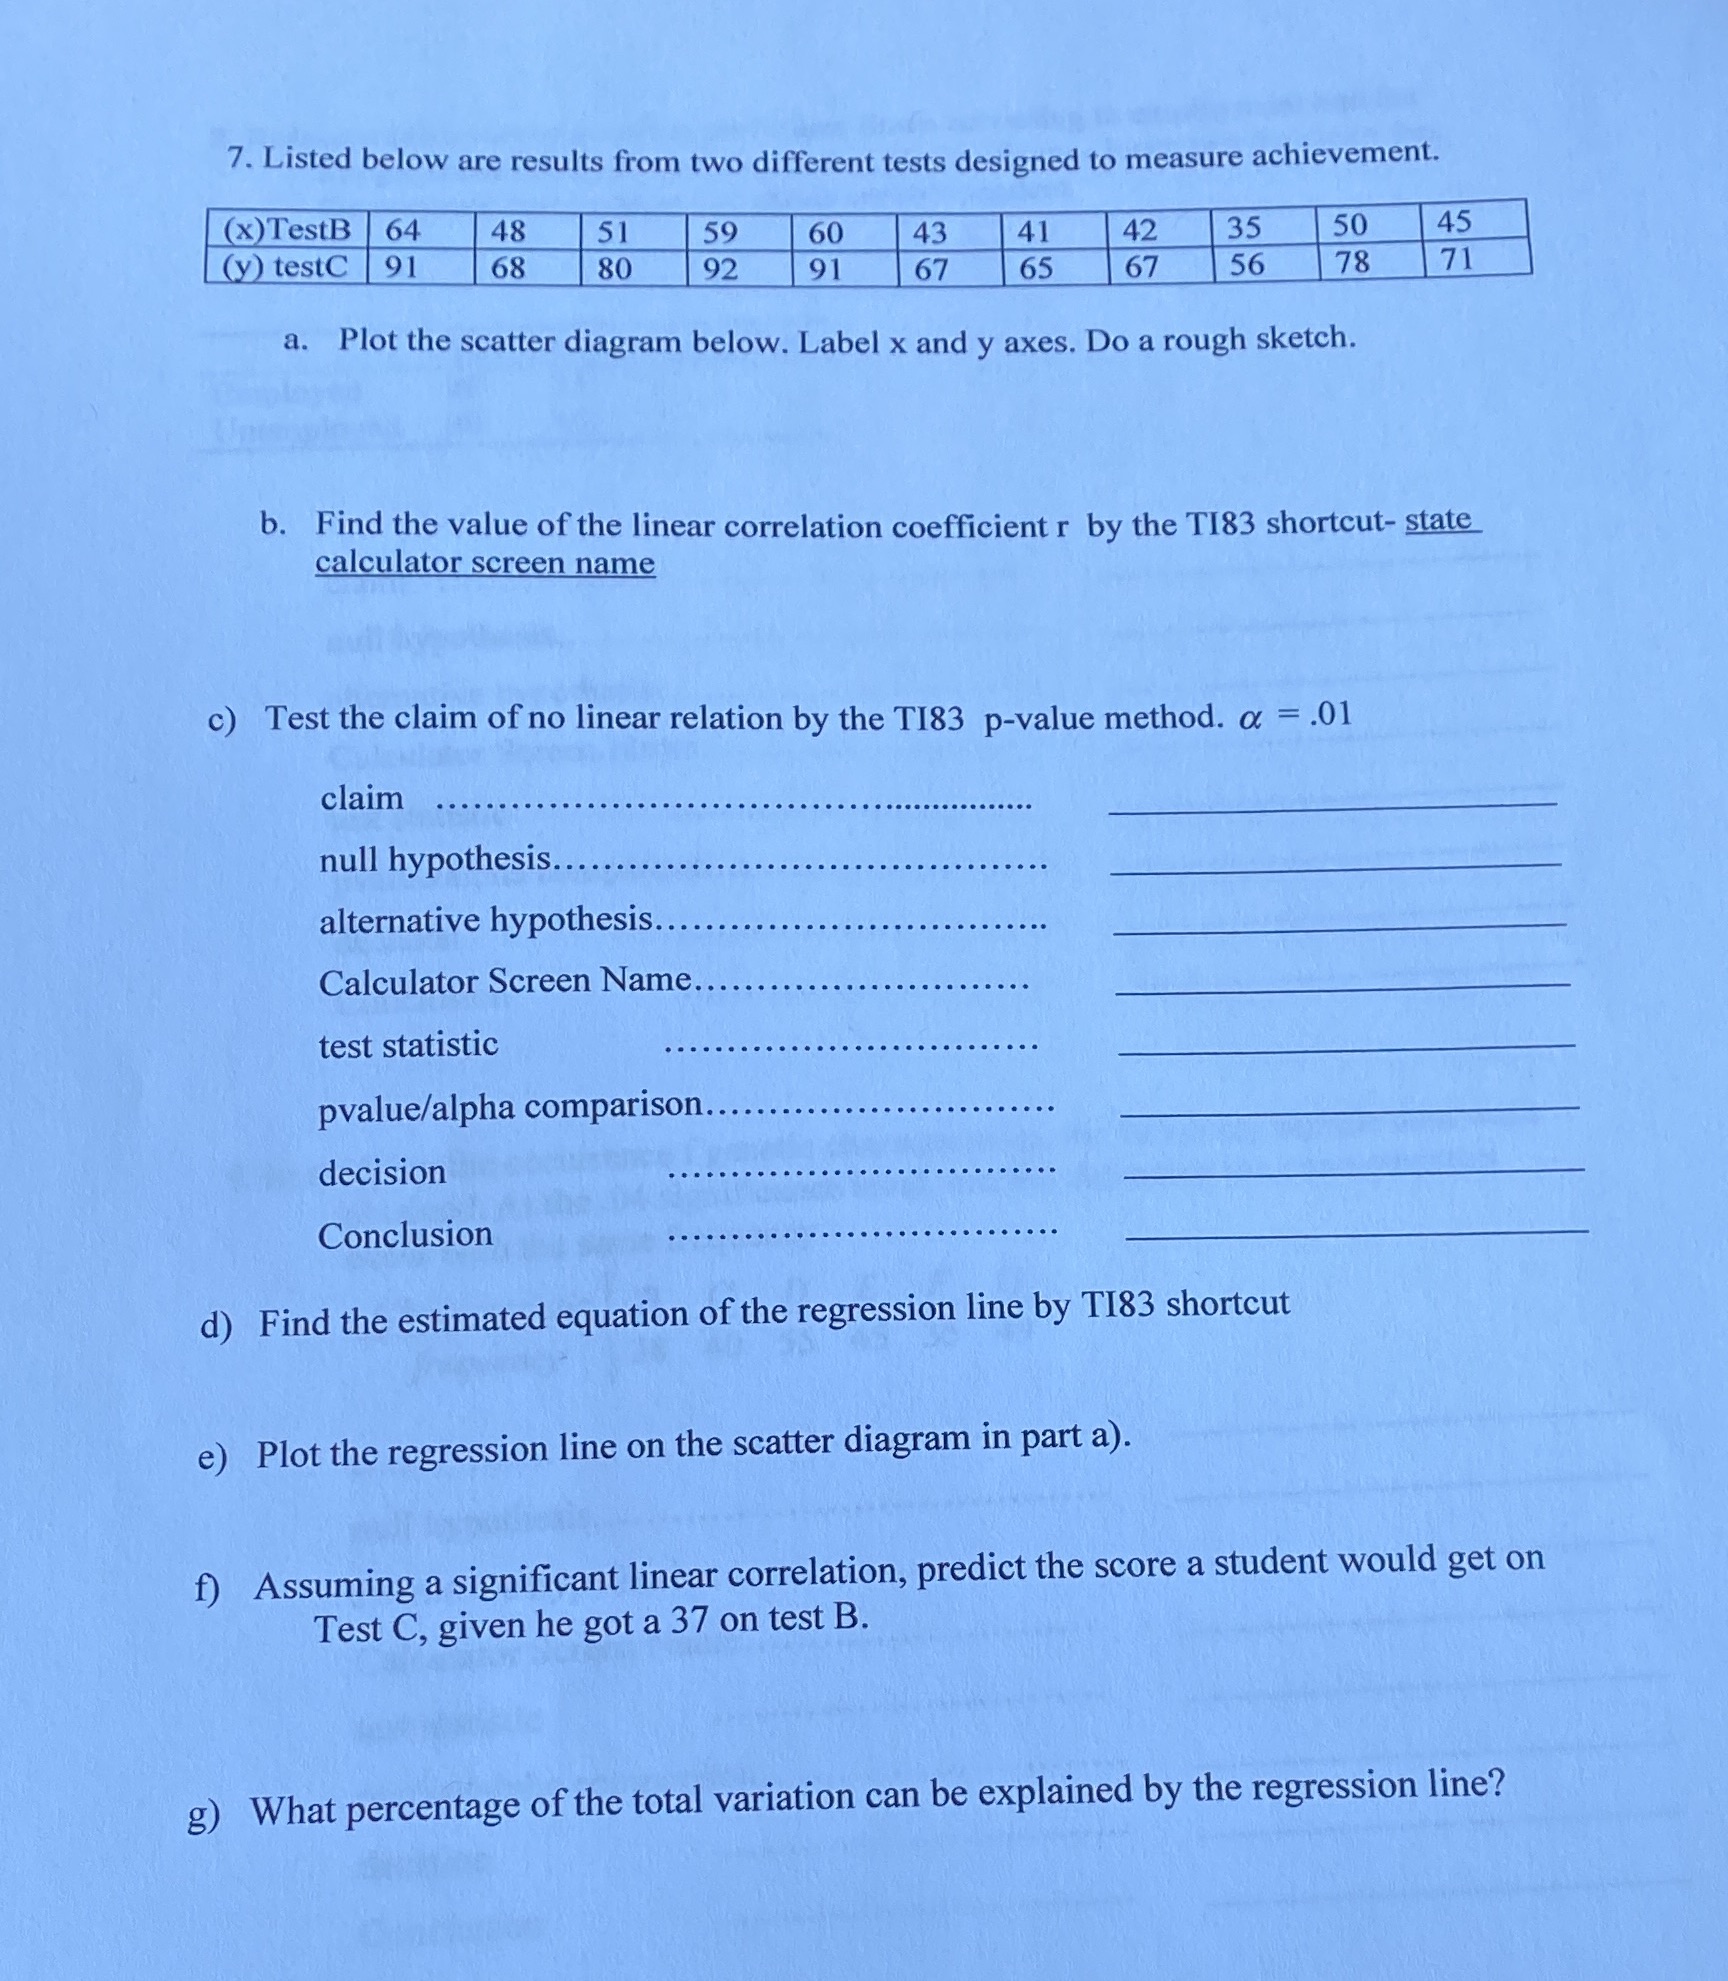
7. Listed below are results from two different tests designed to measure achievement. (x)TestB 64 48 51 59 60 43 41 42 35 50 45 (y) testC 91 68 80 92 91 67 65 67 56 78 71 a. Plot the scatter diagram below. Label x and y axes. Do a rough sketch. b. Find the value of the linear correlation coefficient r by the TI83 shortcut- state calculator screen name c) Test the claim of no linear relation by the T183 p-value method. a = .01 claim null hypothesis....... alternative hypothesis... Calculator Screen Name.......... test statistic pvalue/alpha comparison........ decision Conclusion d) Find the estimated equation of the regression line by T183 shortcut e) Plot the regression line on the scatter diagram in part a). f) Assuming a significant linear correlation, predict the score a student would get on Test C, given he got a 37 on test B. g) What percentage of the total variation can be explained by the regression line
Step by Step Solution
There are 3 Steps involved in it

Get step-by-step solutions from verified subject matter experts