

Question: 7 mins very urgent !! The statistical chart compiled by John and co shows that the Annual Returns on Long Term Government Bonds for the
7 mins very urgent !!
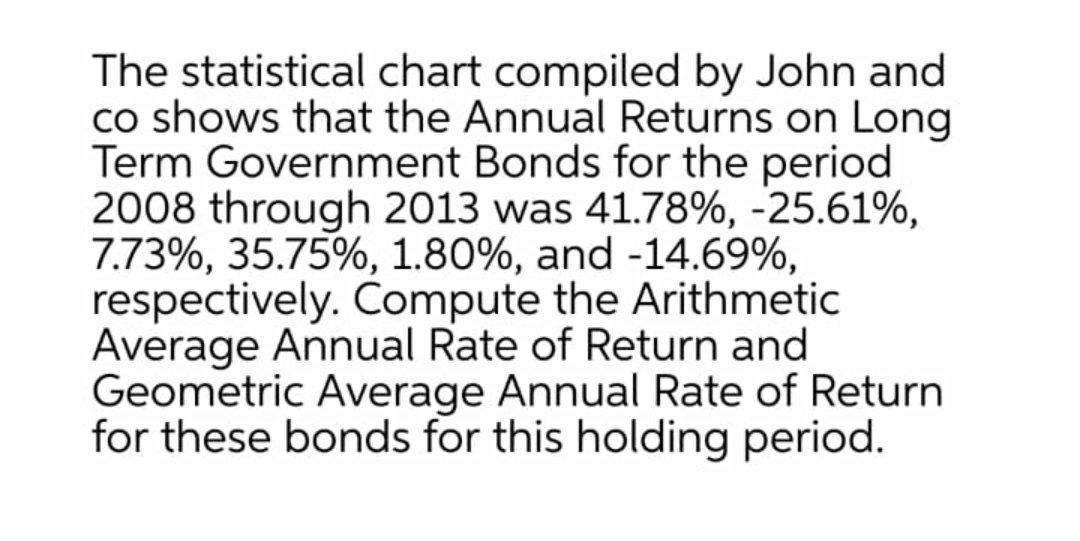
The statistical chart compiled by John and co shows that the Annual Returns on Long Term Government Bonds for the period 2008 through 2013 was 41.78%, -25.61%, 7.73%, 35.75%, 1.80%, and -14.69%, respectively. Compute the Arithmetic Average Annual Rate of Return and Geometric Average Annual Rate of Return for these bonds for this holding period
Step by Step Solution
There are 3 Steps involved in it
1 Expert Approved Answer
Step: 1 Unlock

Question Has Been Solved by an Expert!
Get step-by-step solutions from verified subject matter experts
Step: 2 Unlock
Step: 3 Unlock