

Question: 7 of 7 /'| Current Attempt in Progress Two sets of sample data, A and B, are given. Without doing any calculations, indicate in which
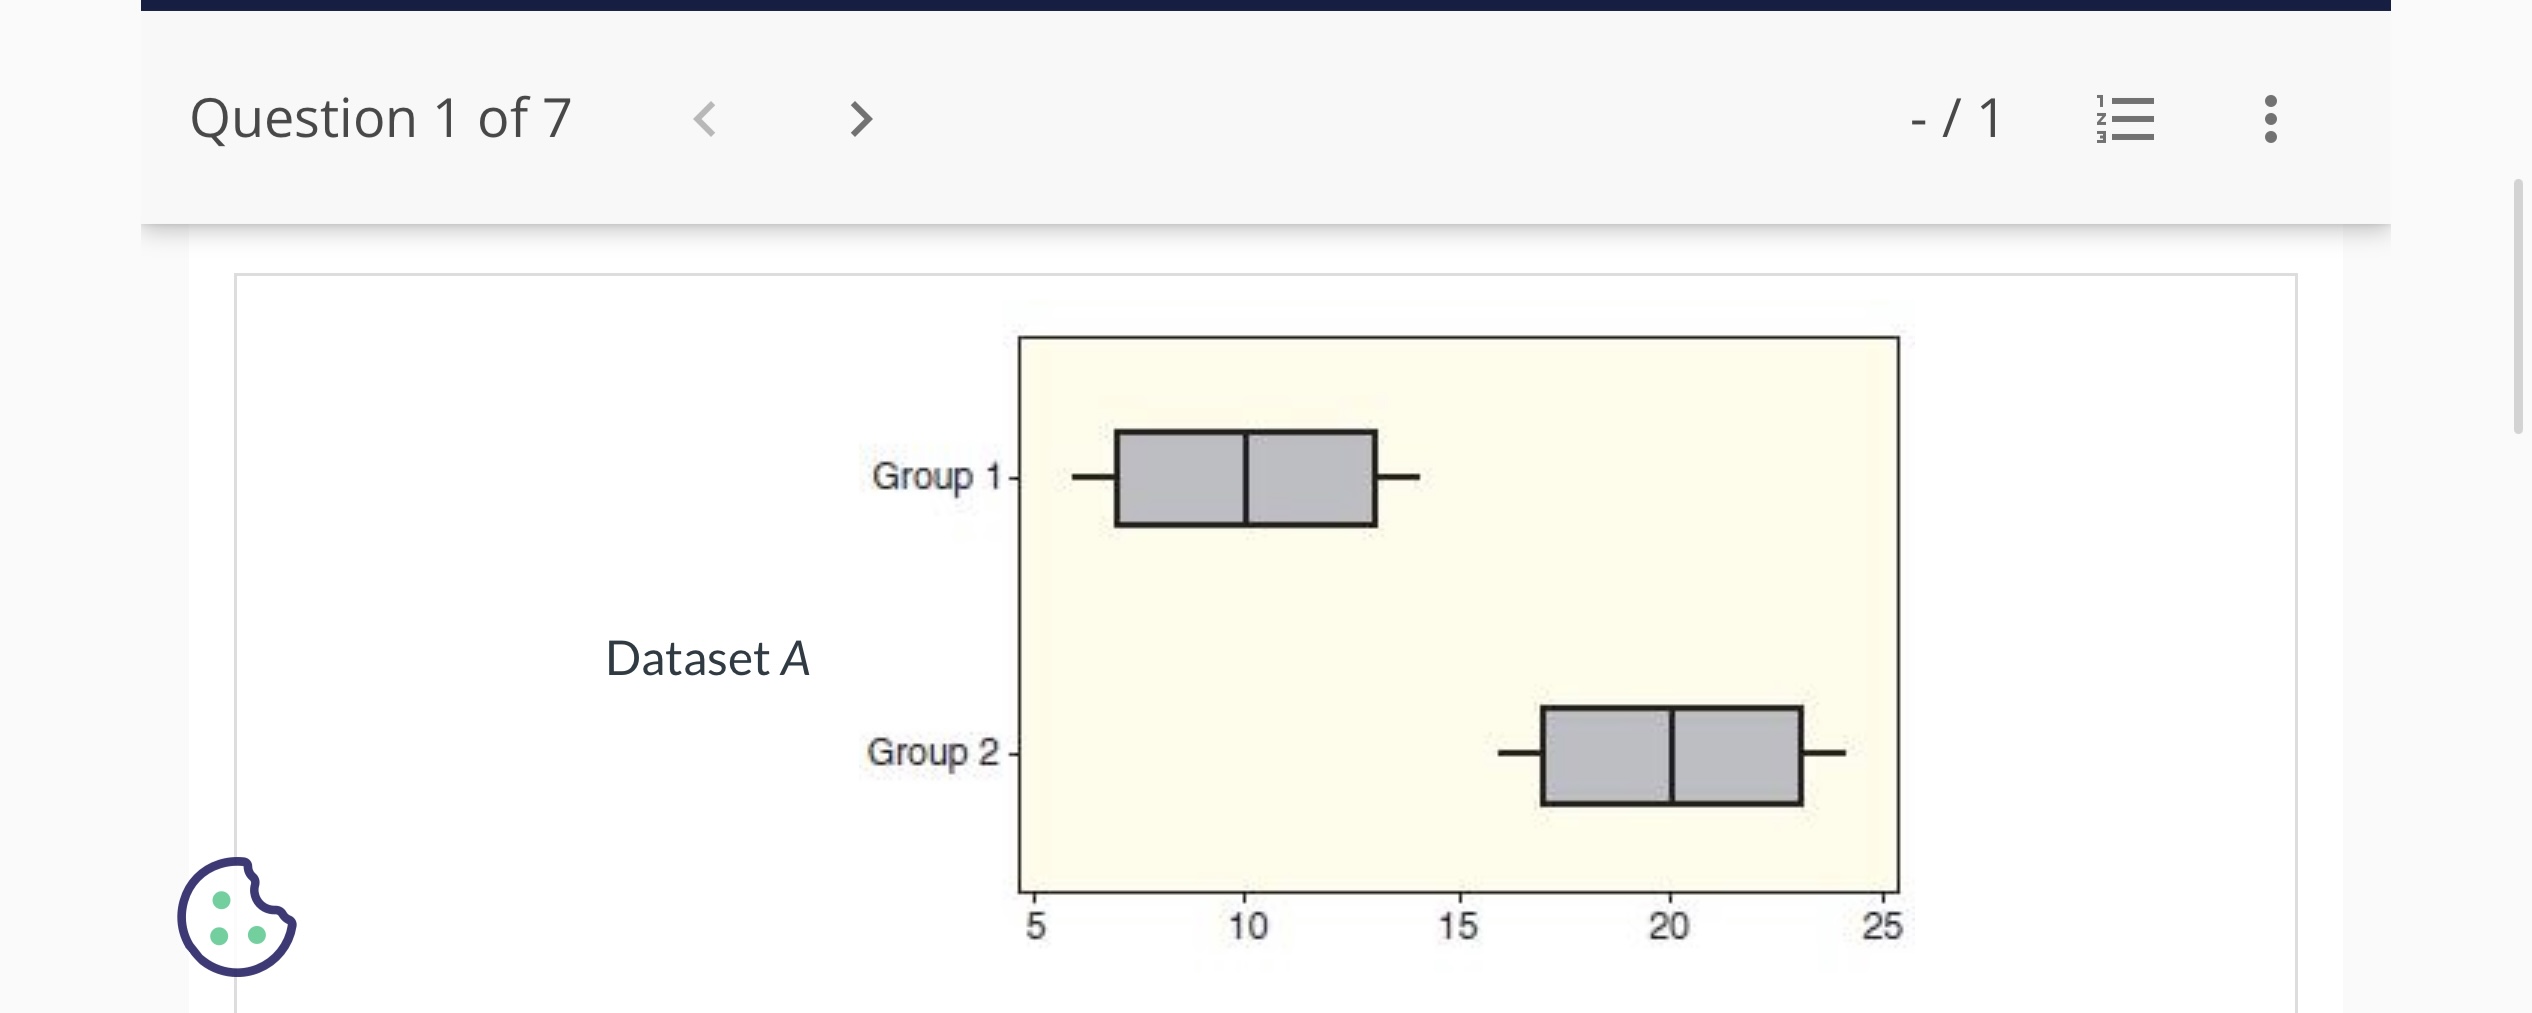
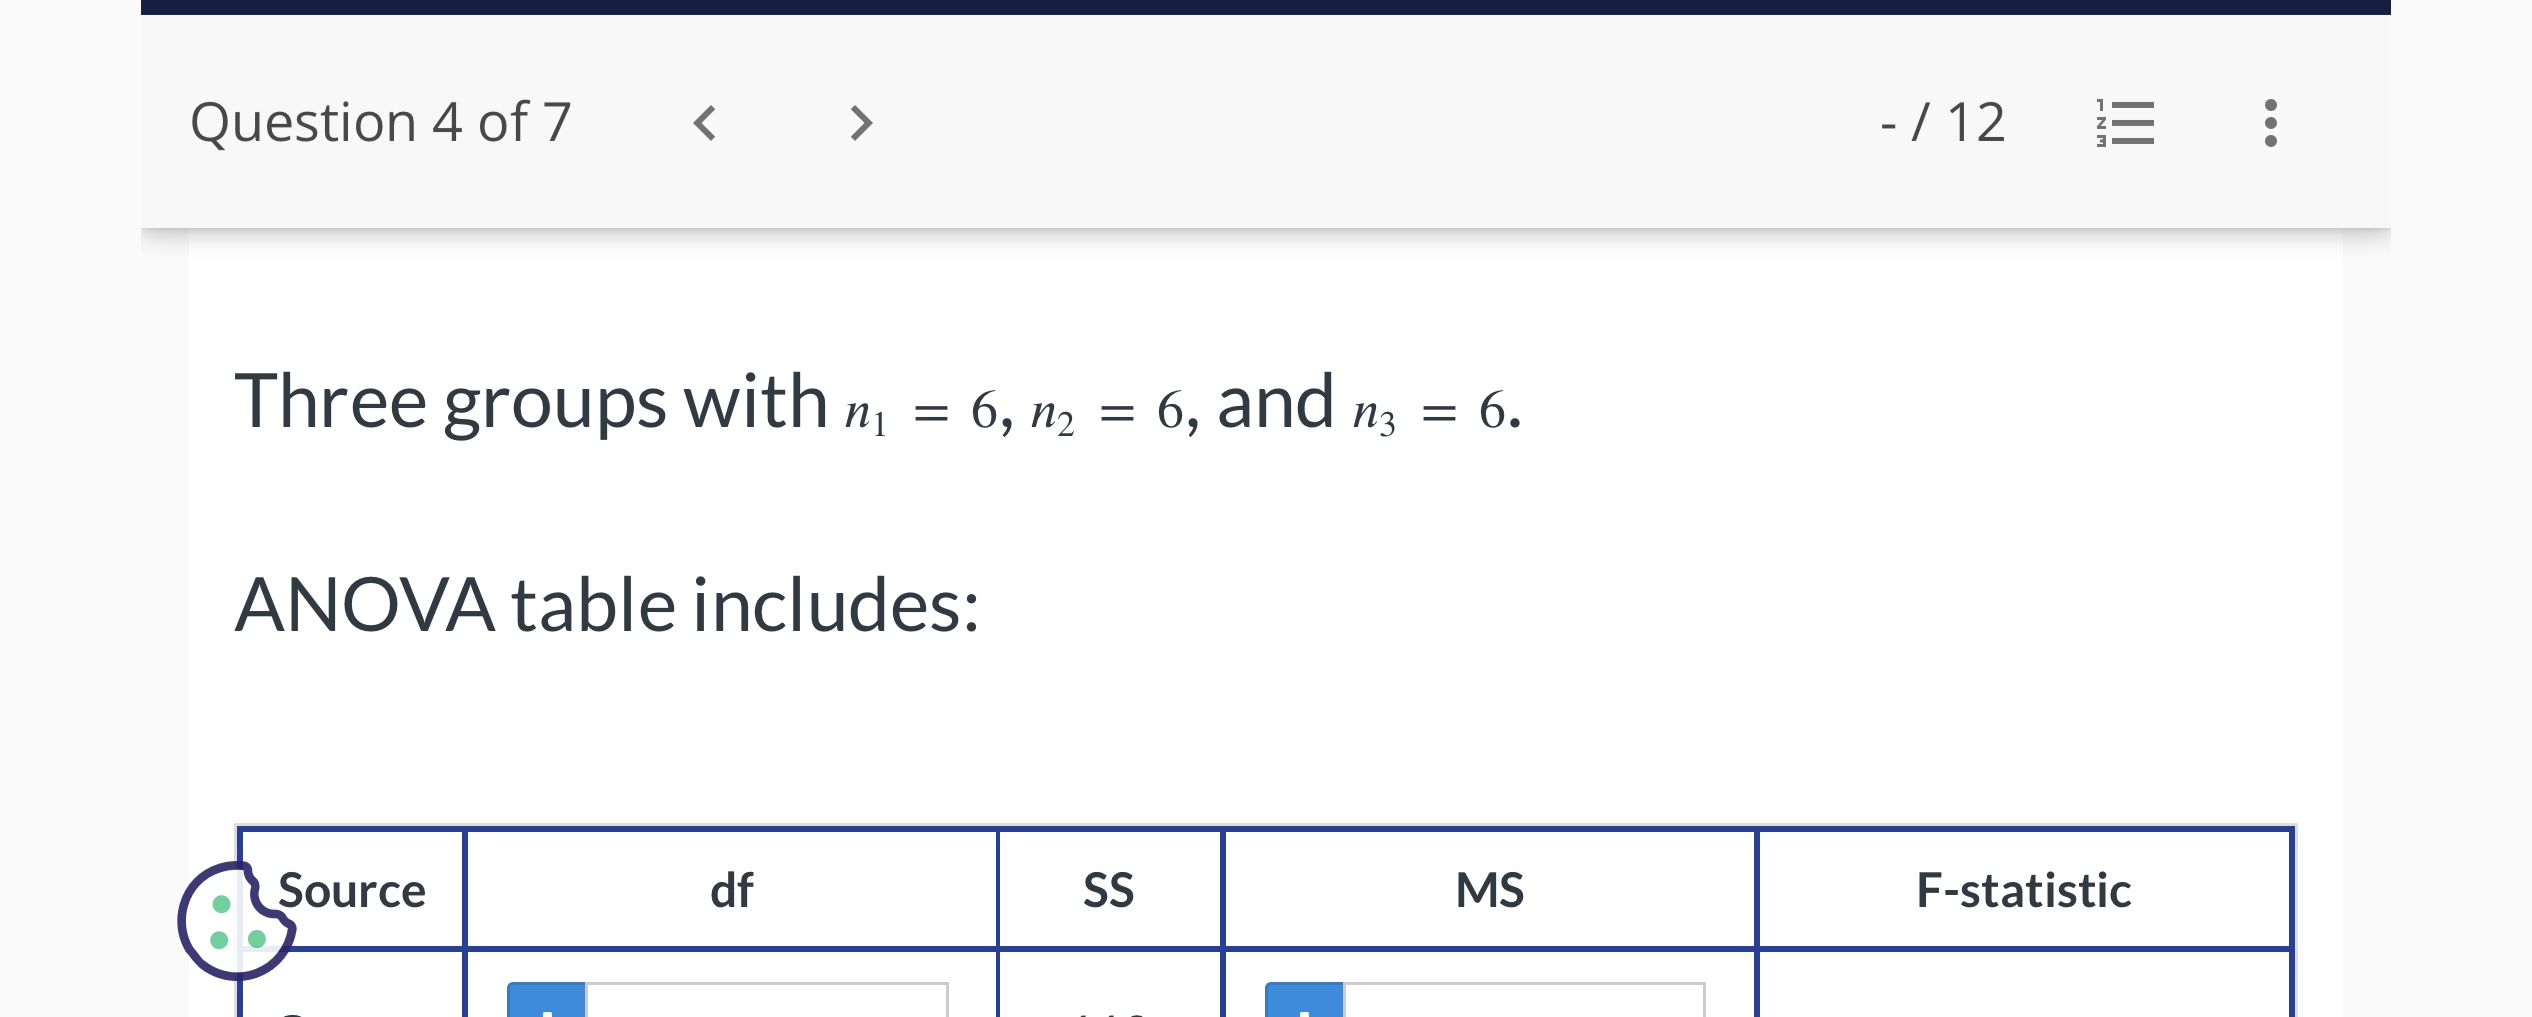
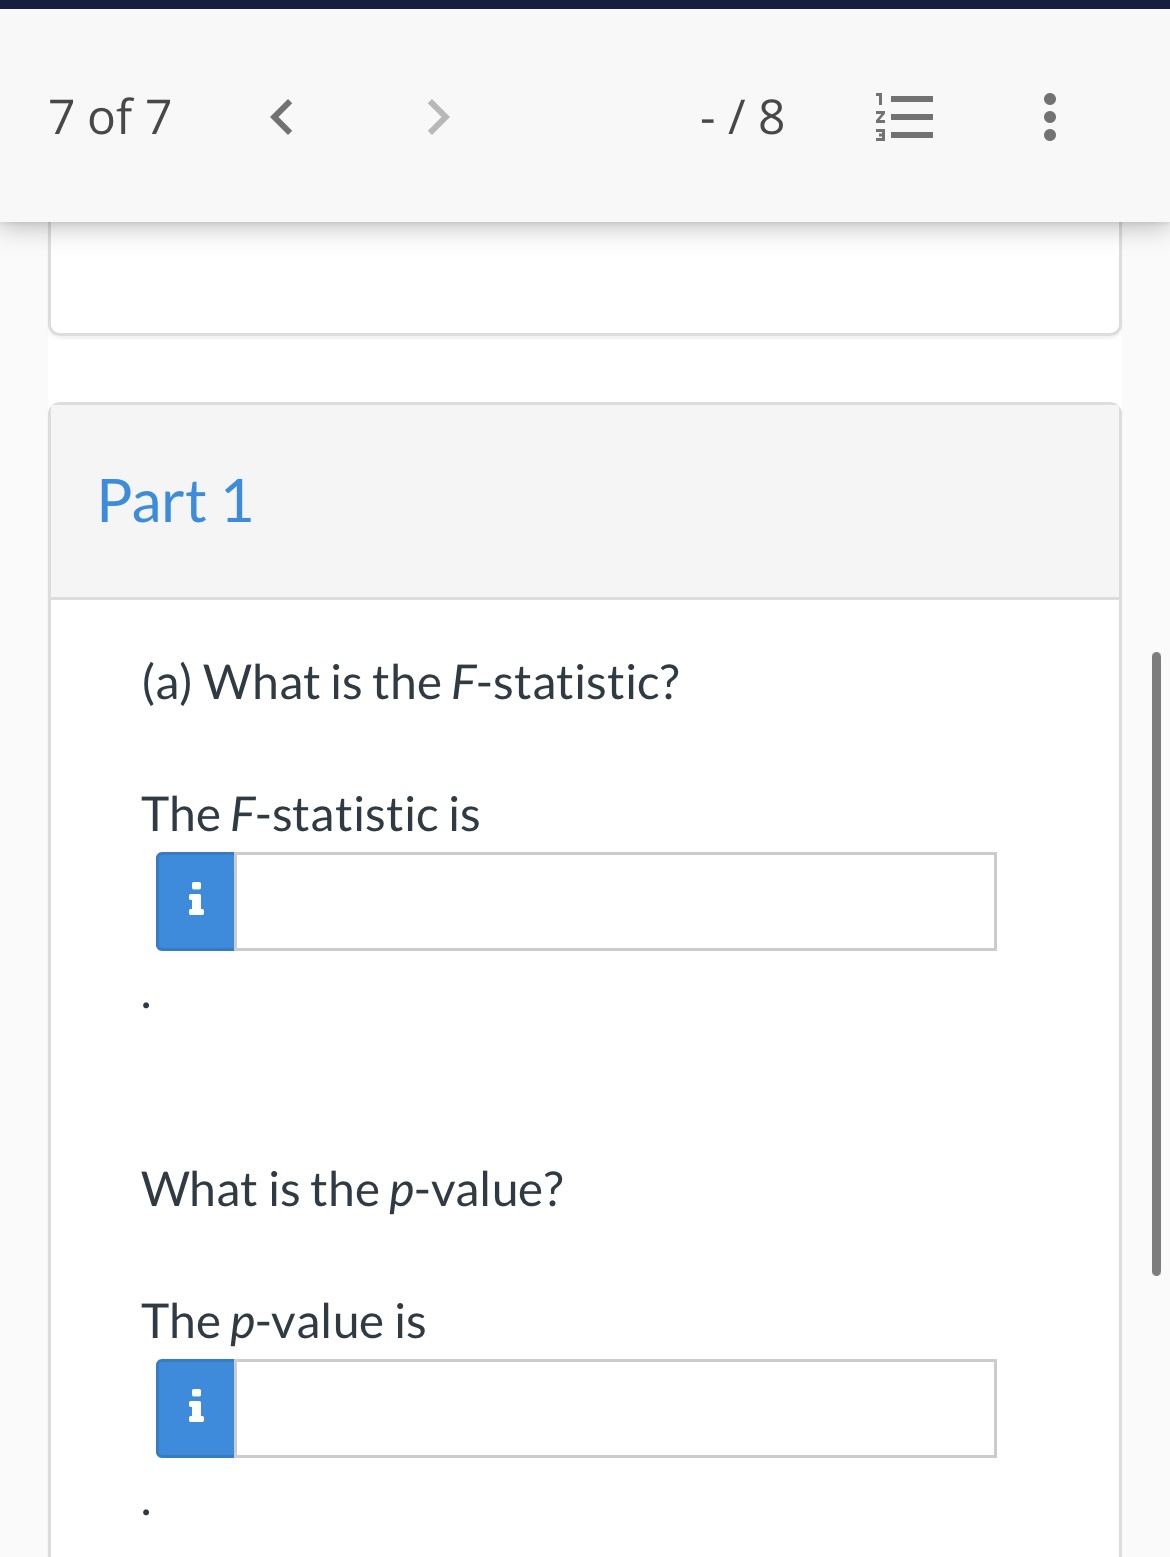
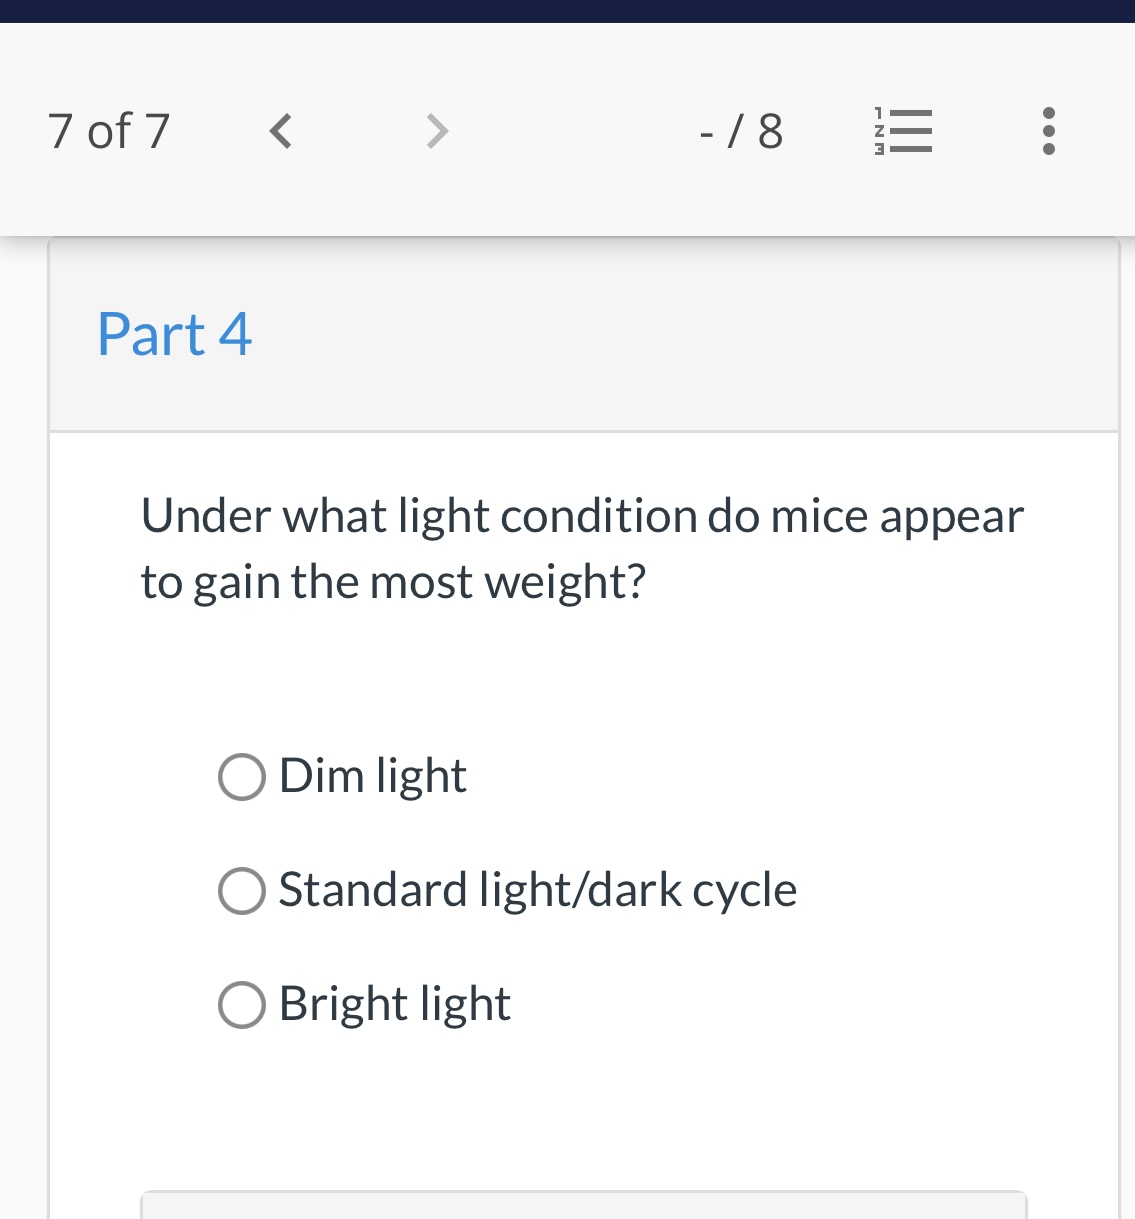
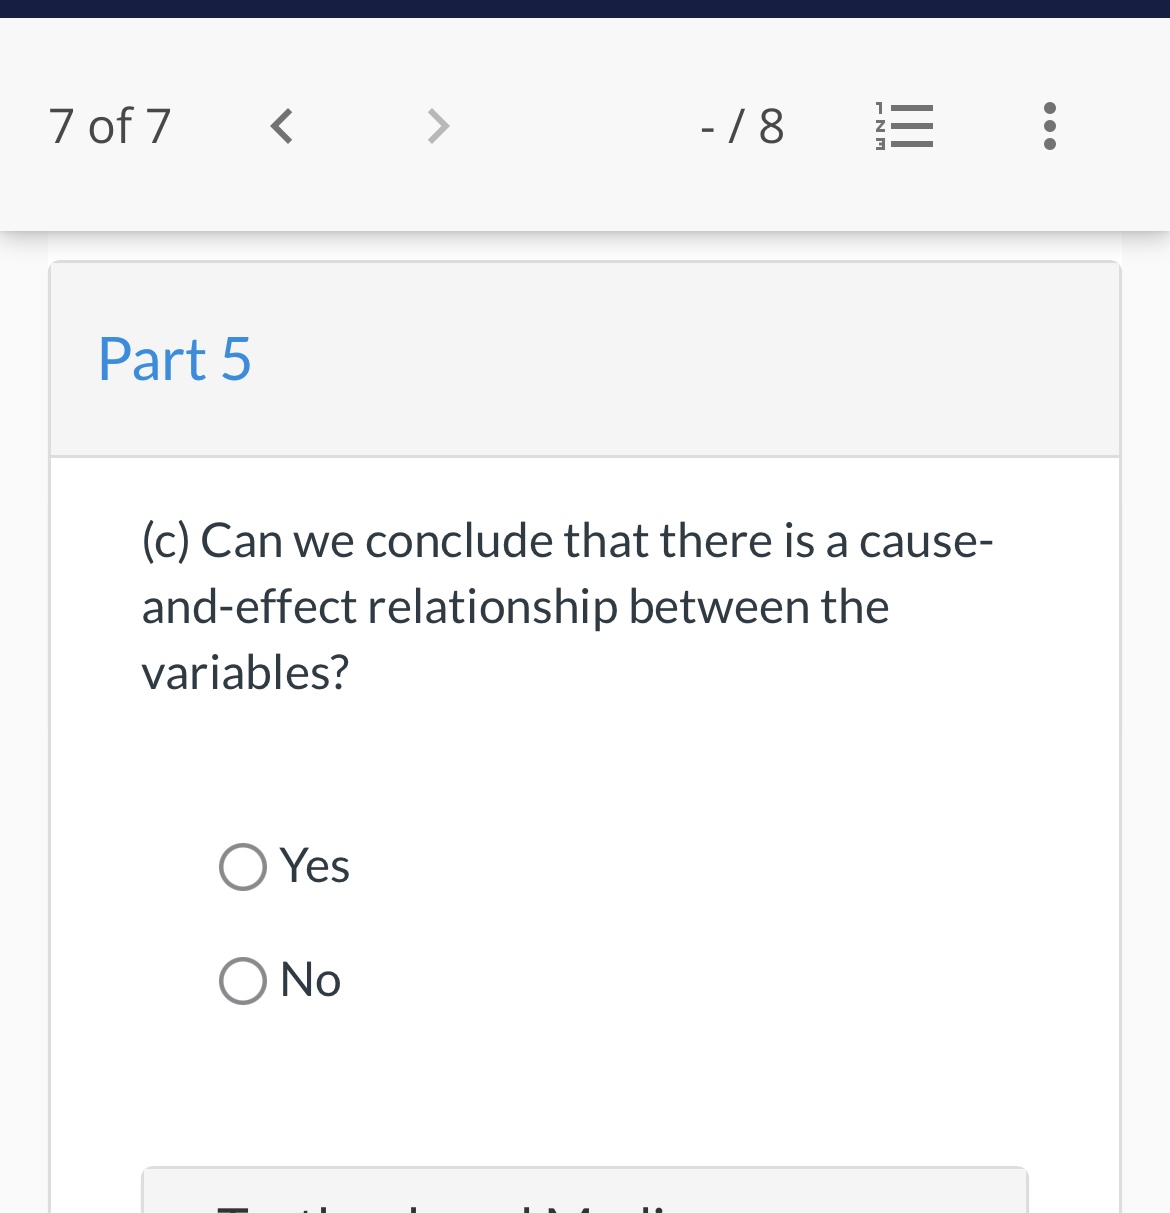
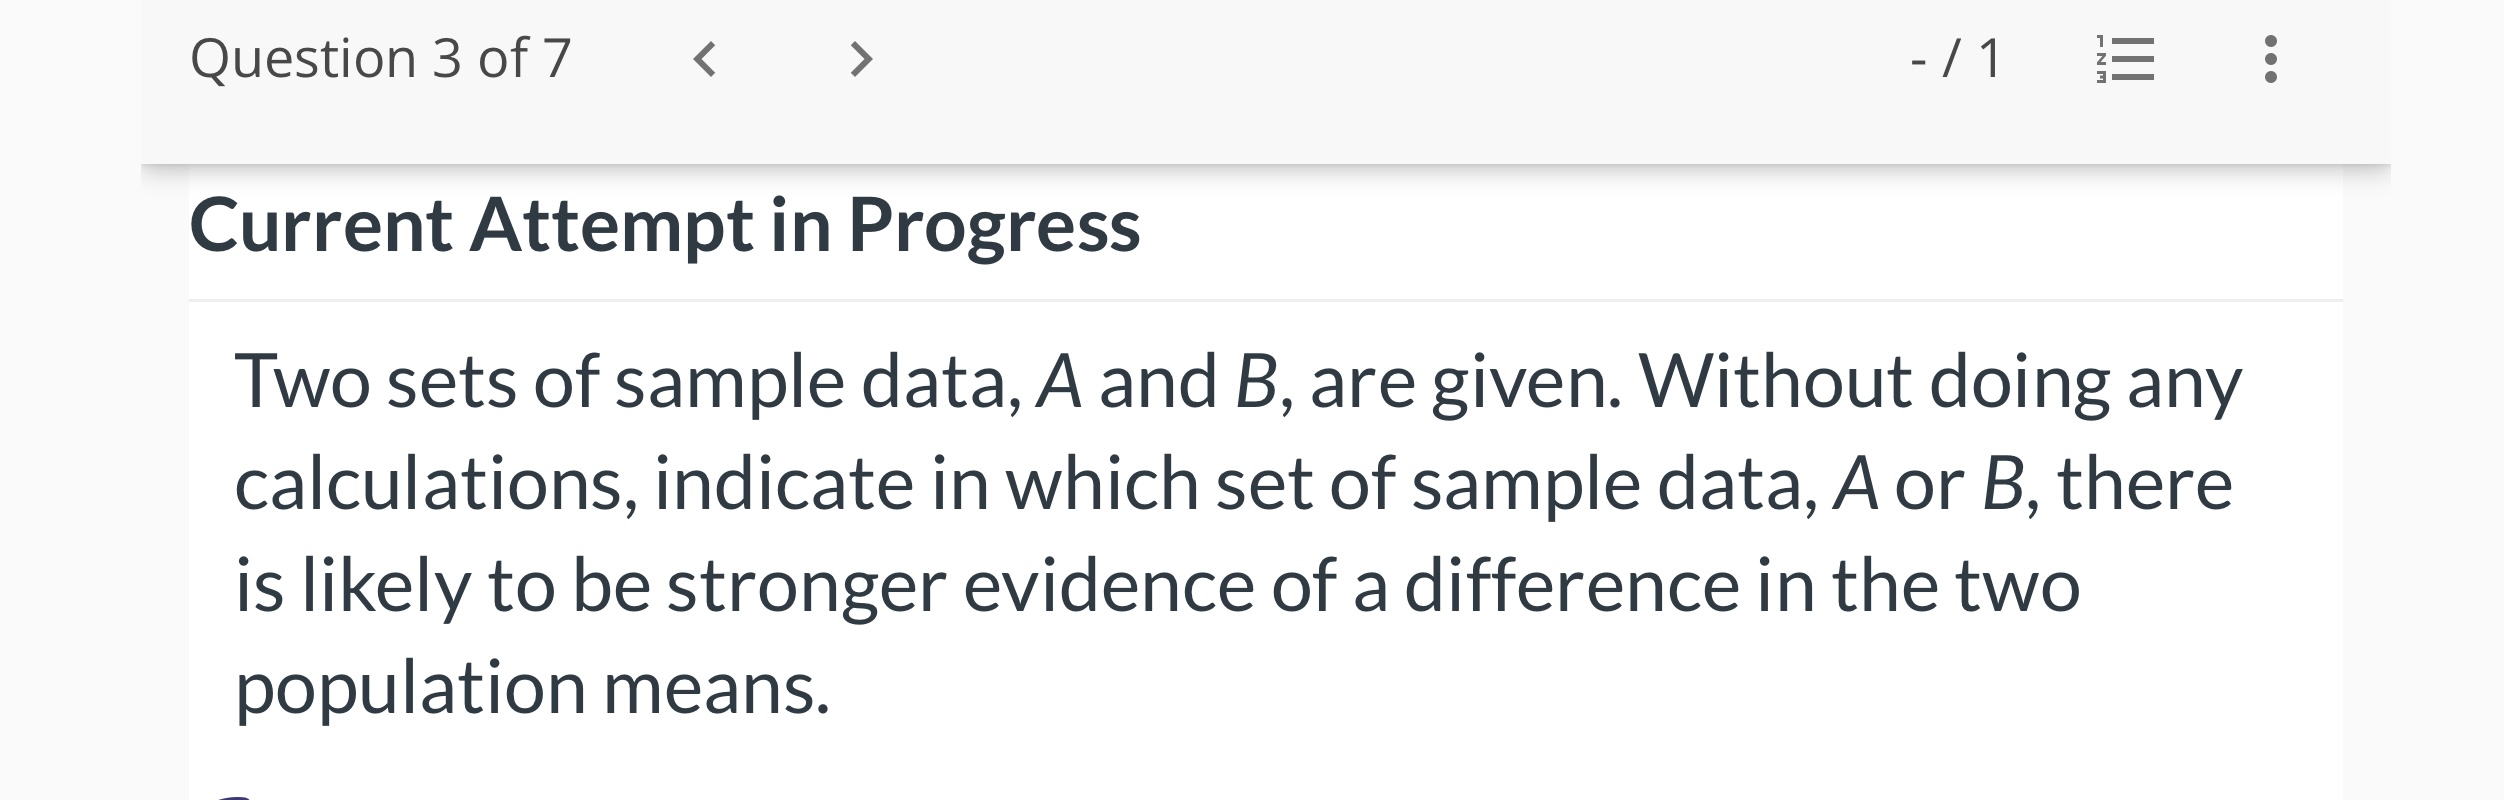
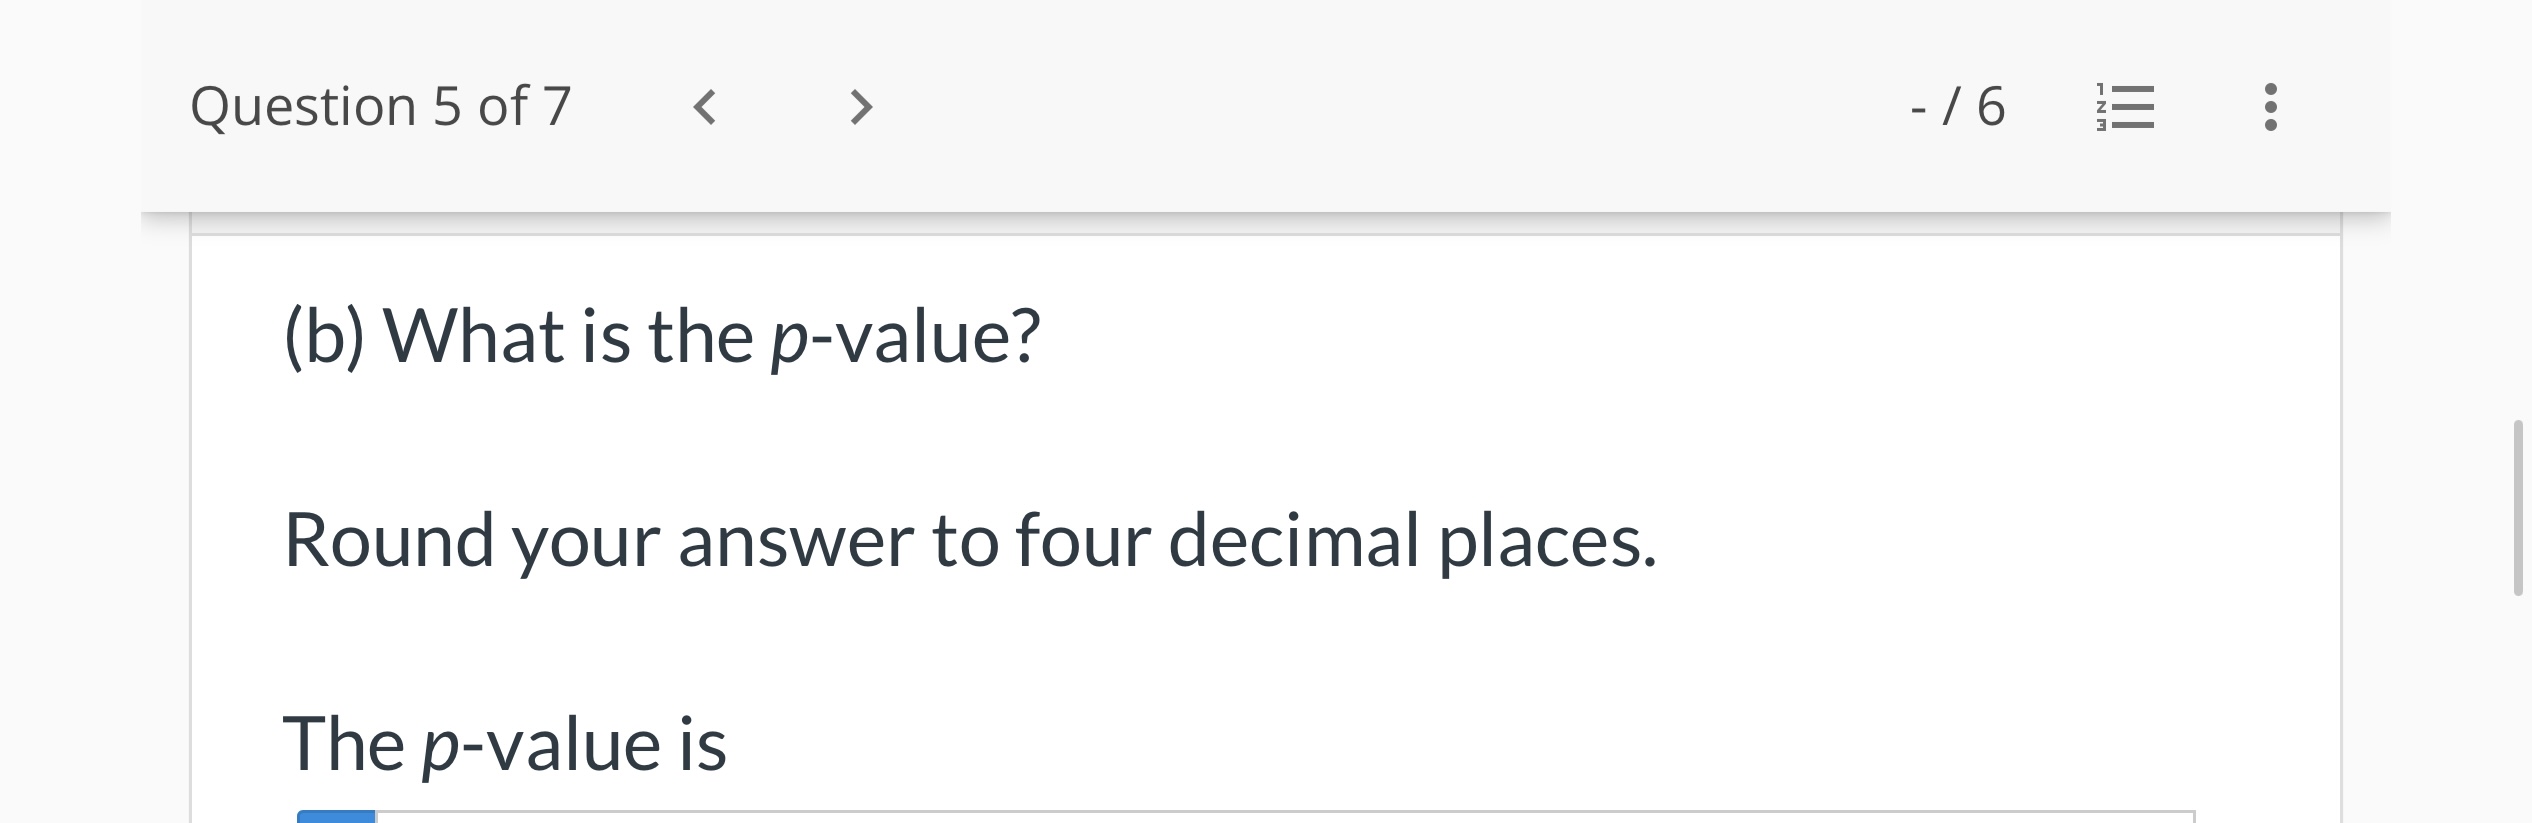
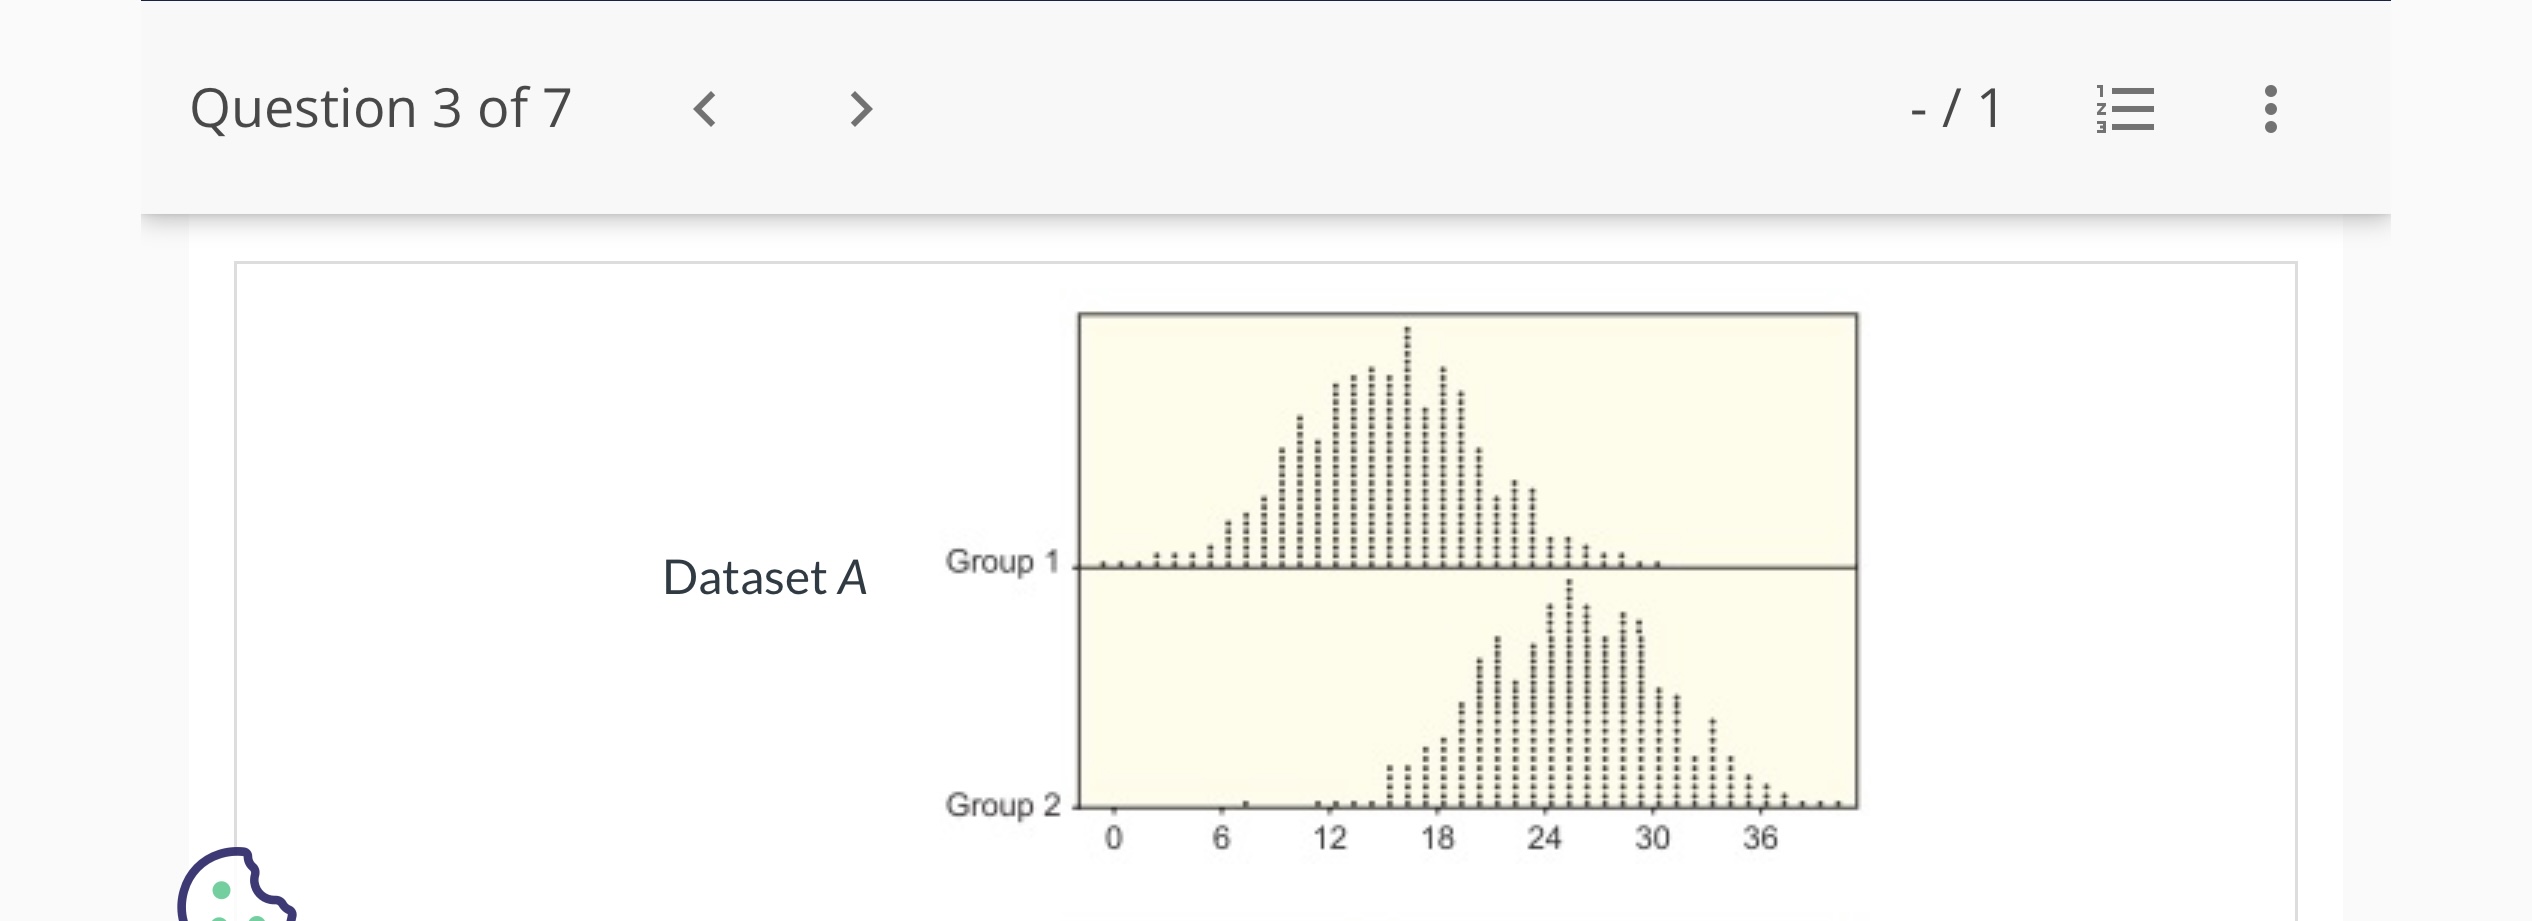
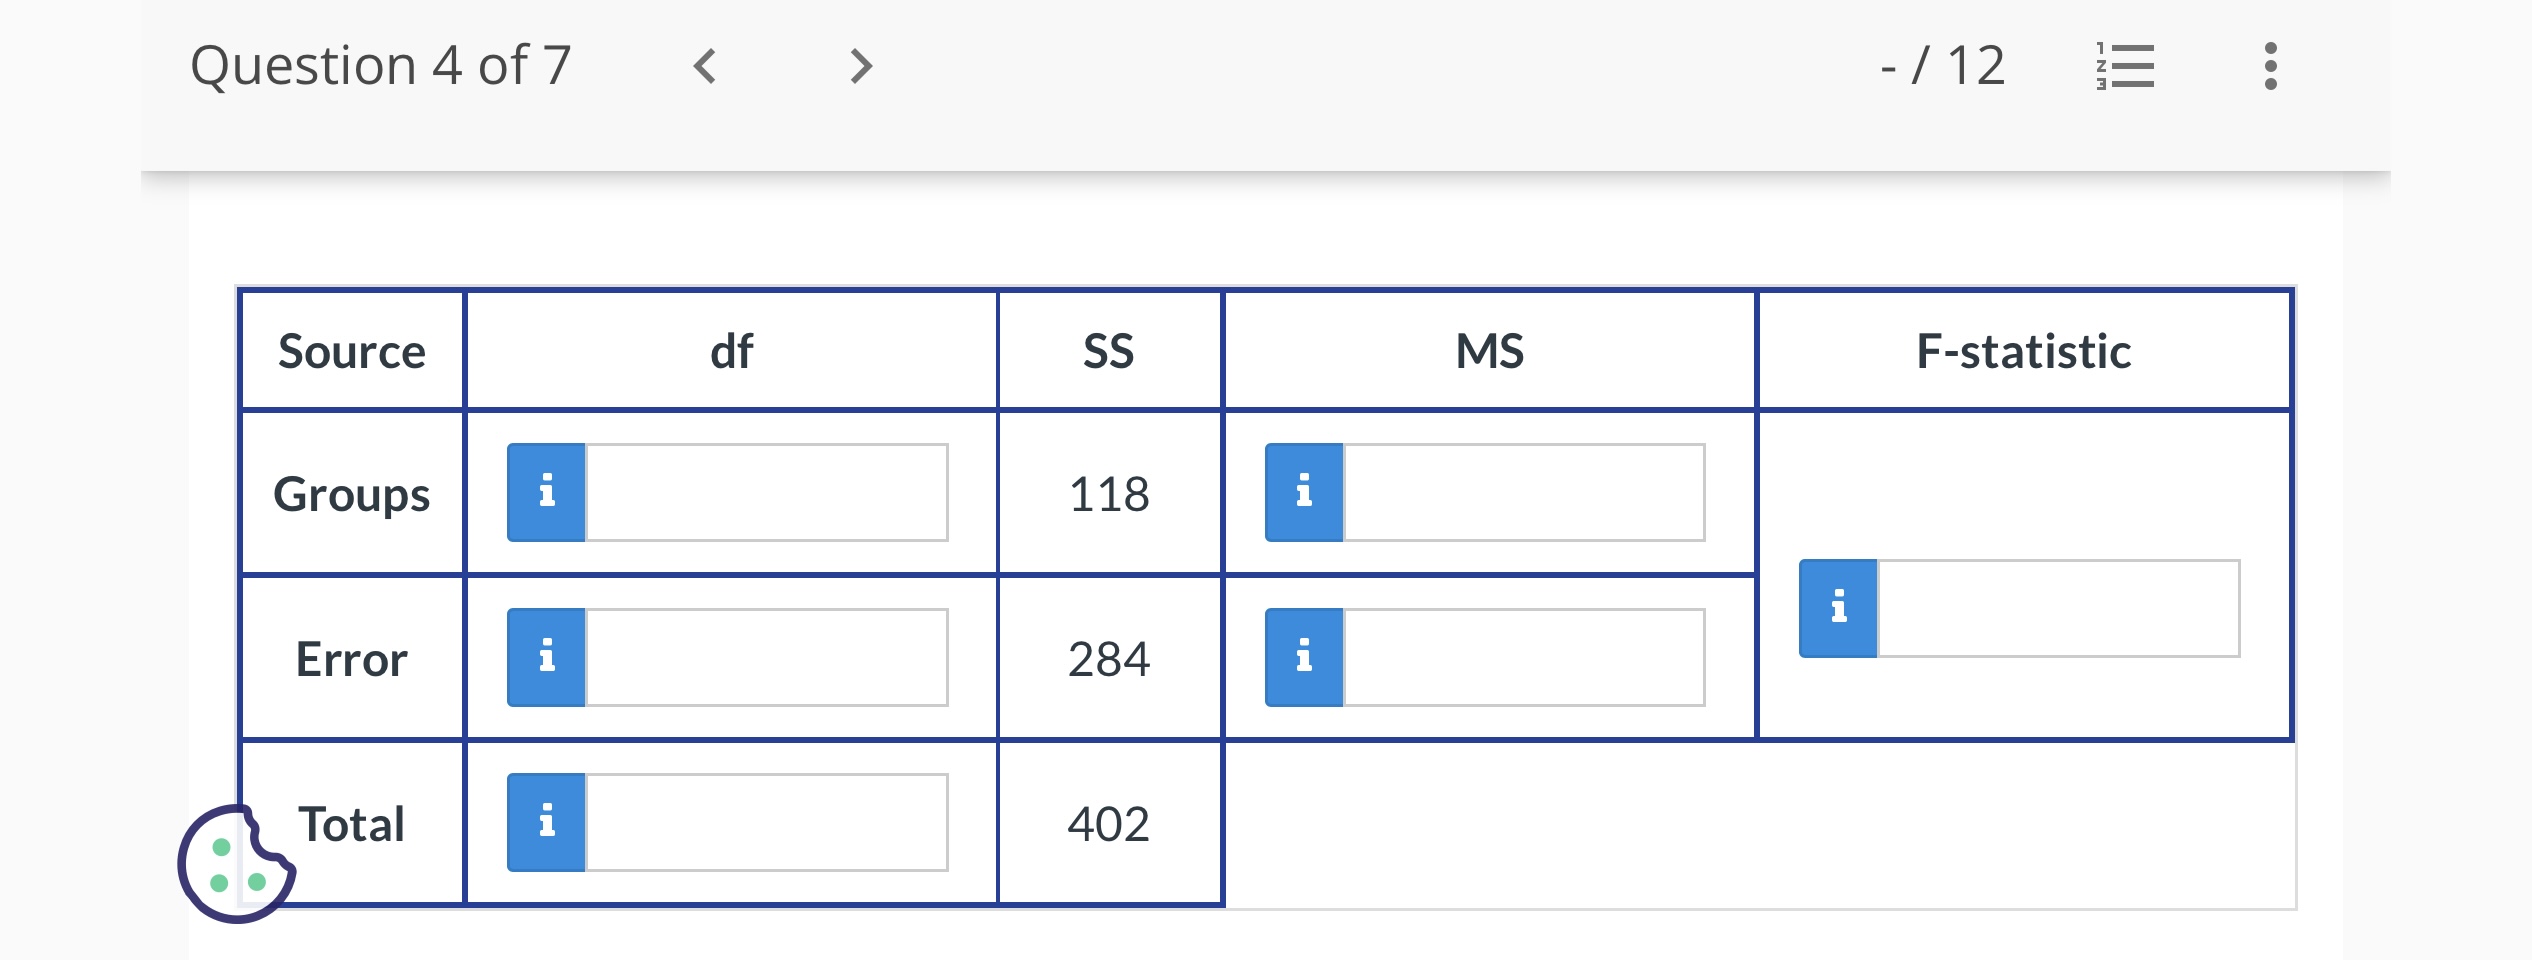
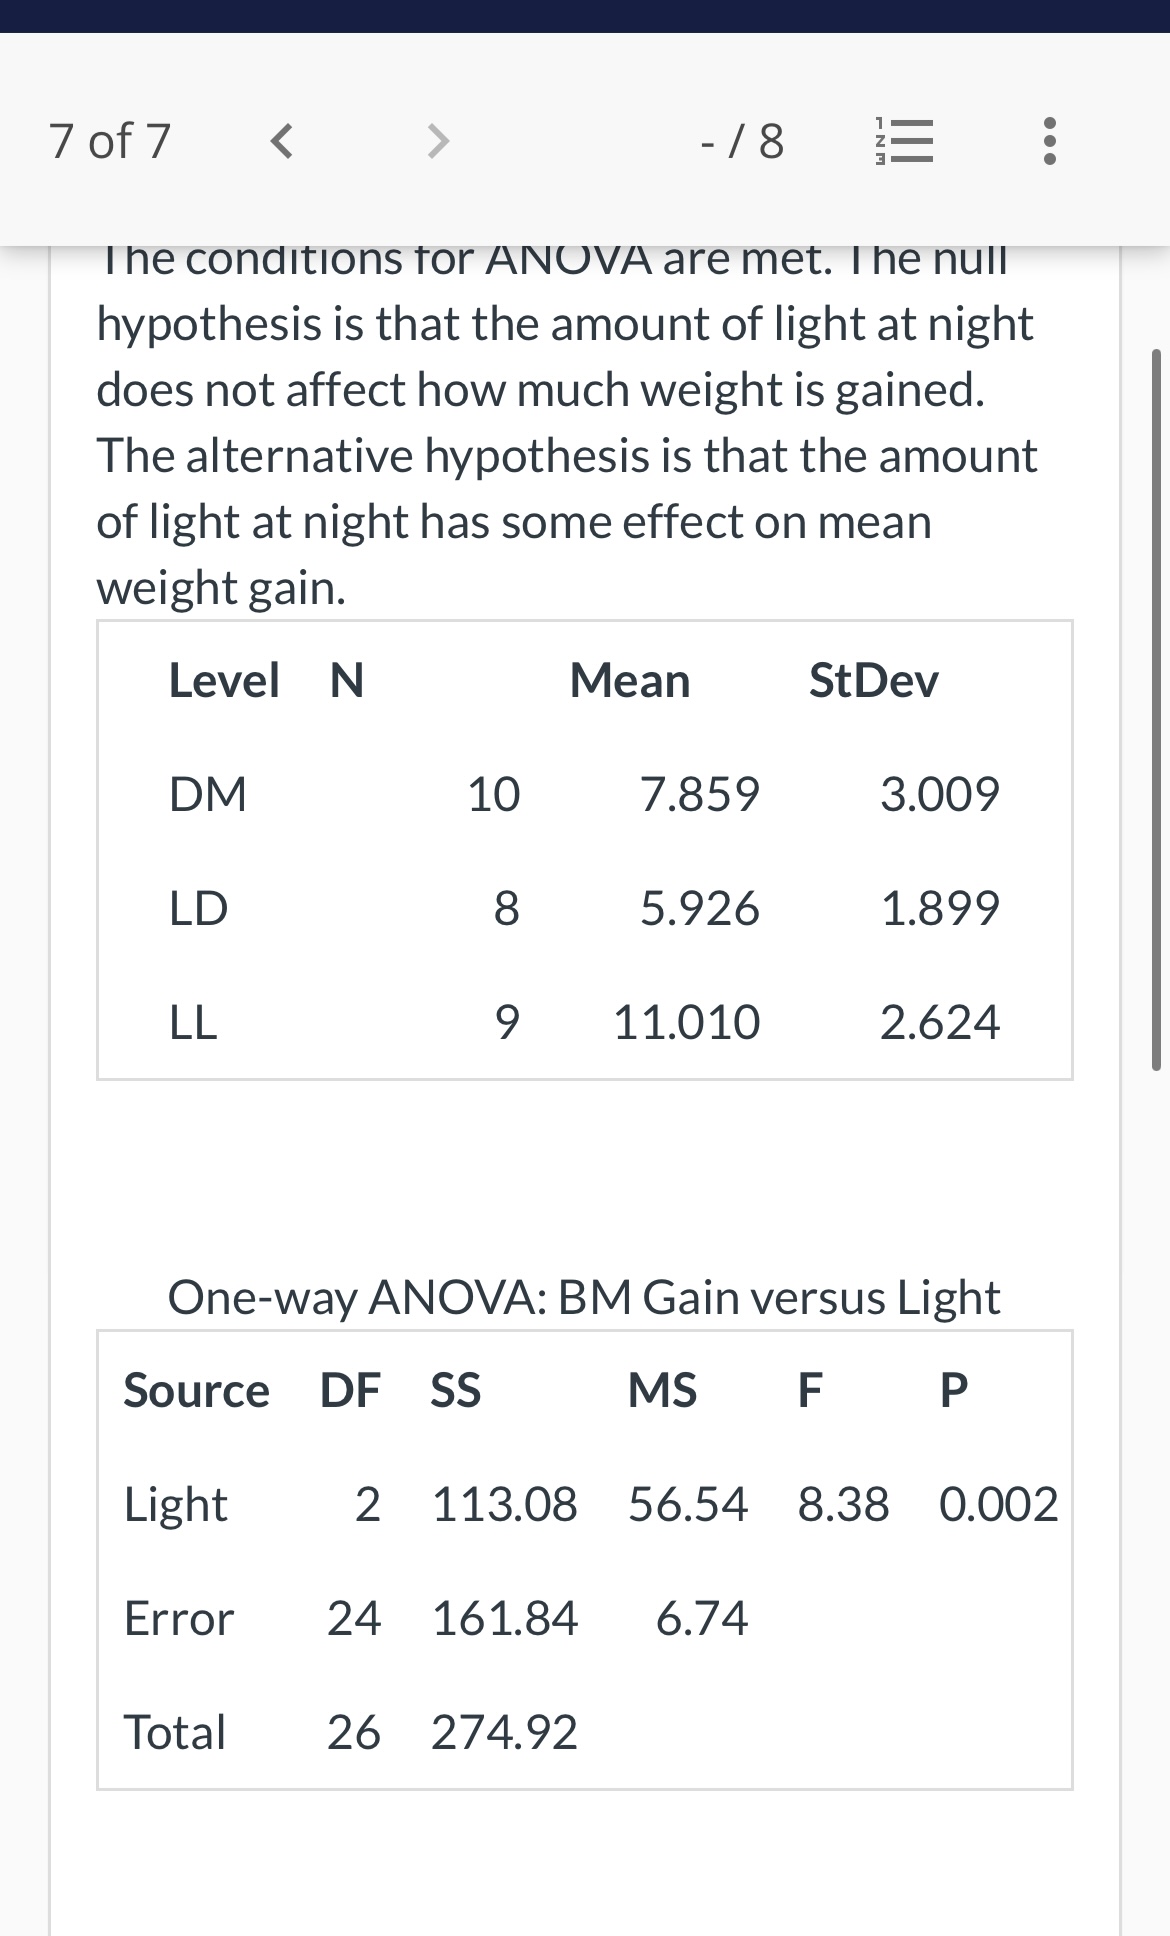
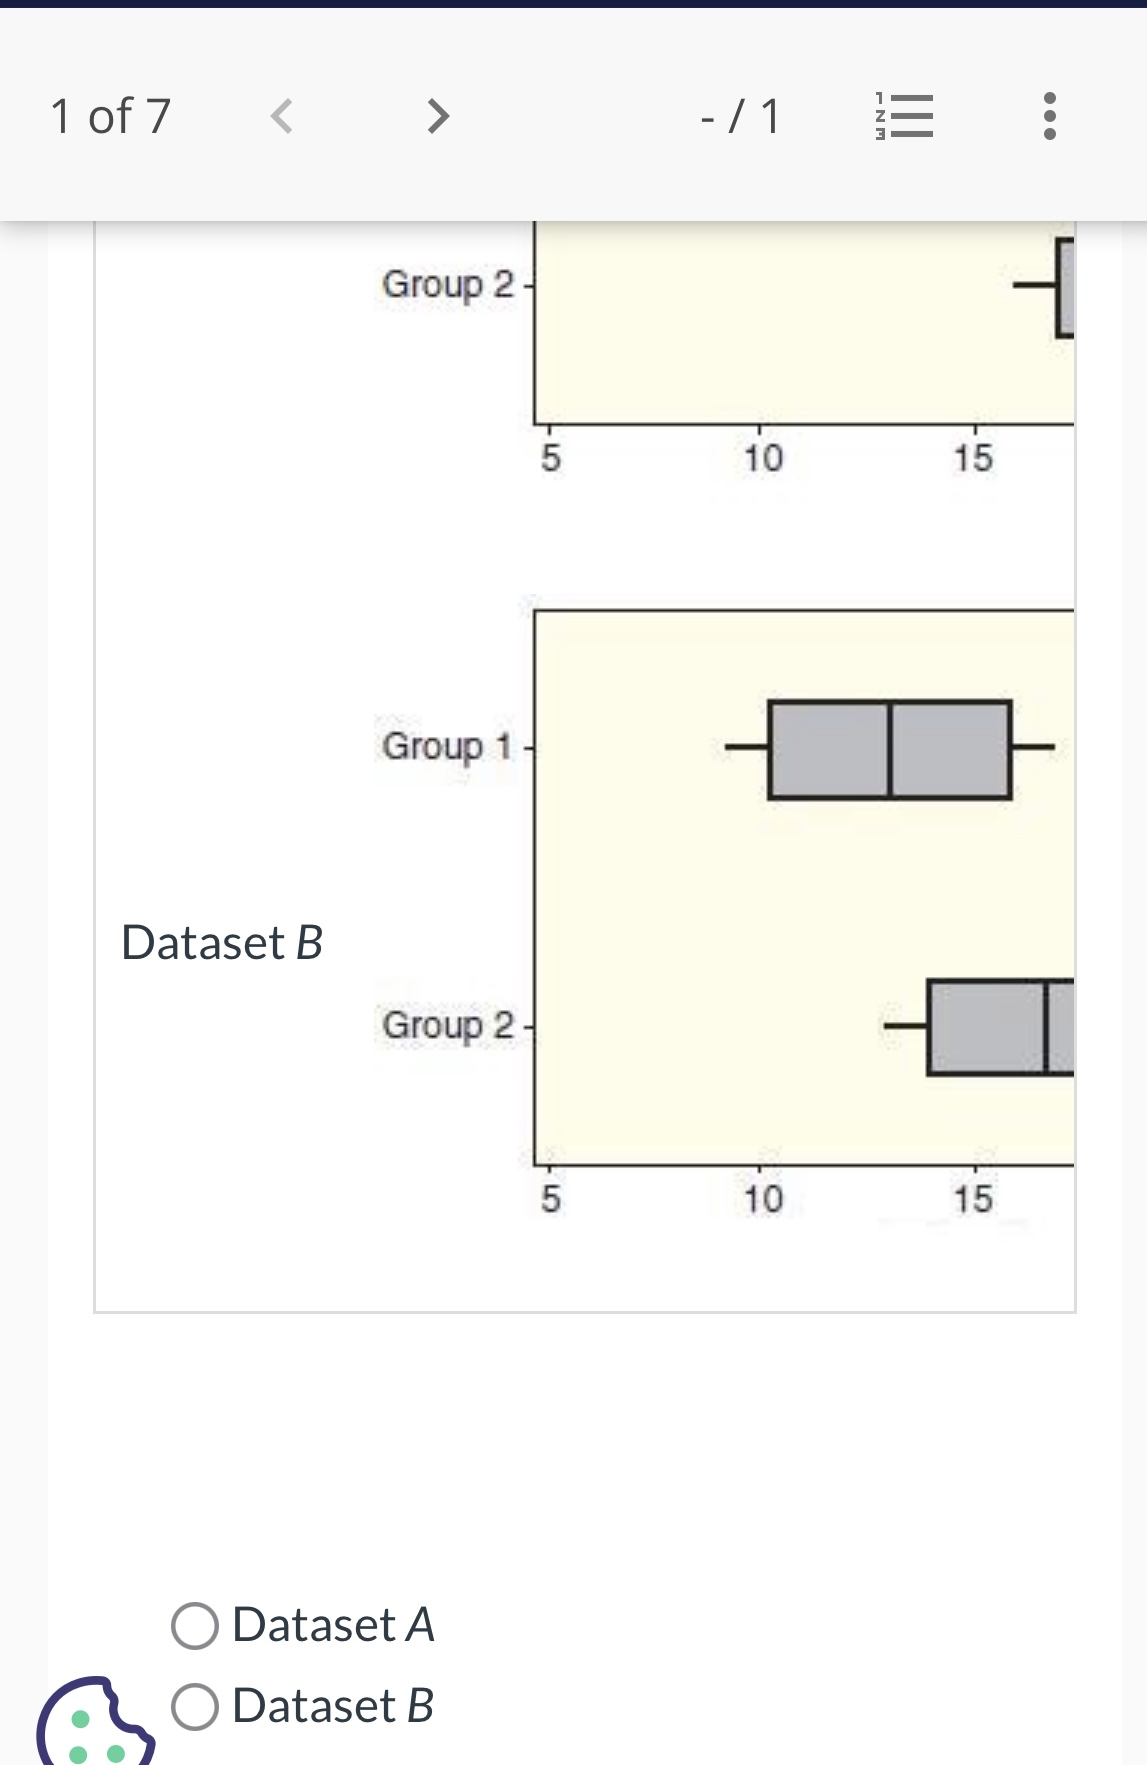
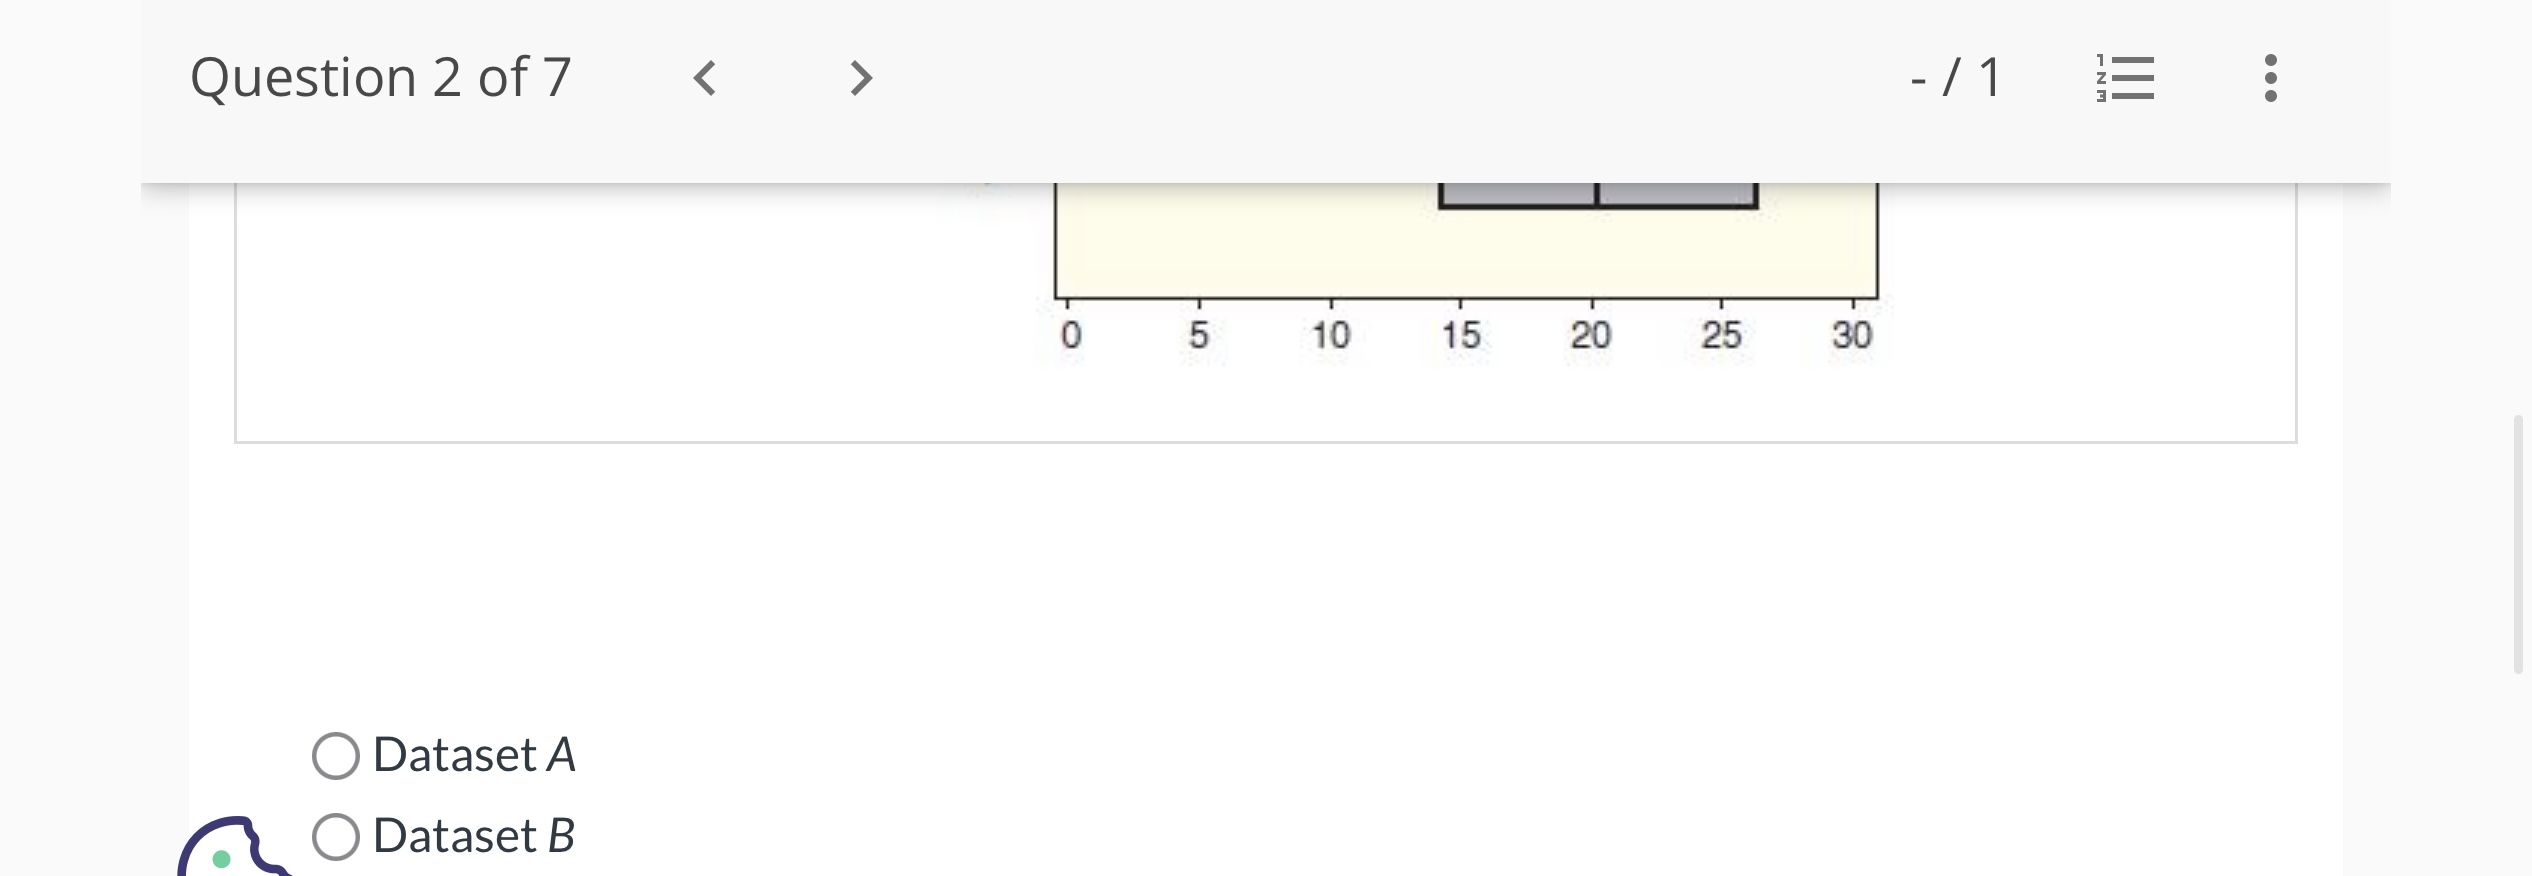
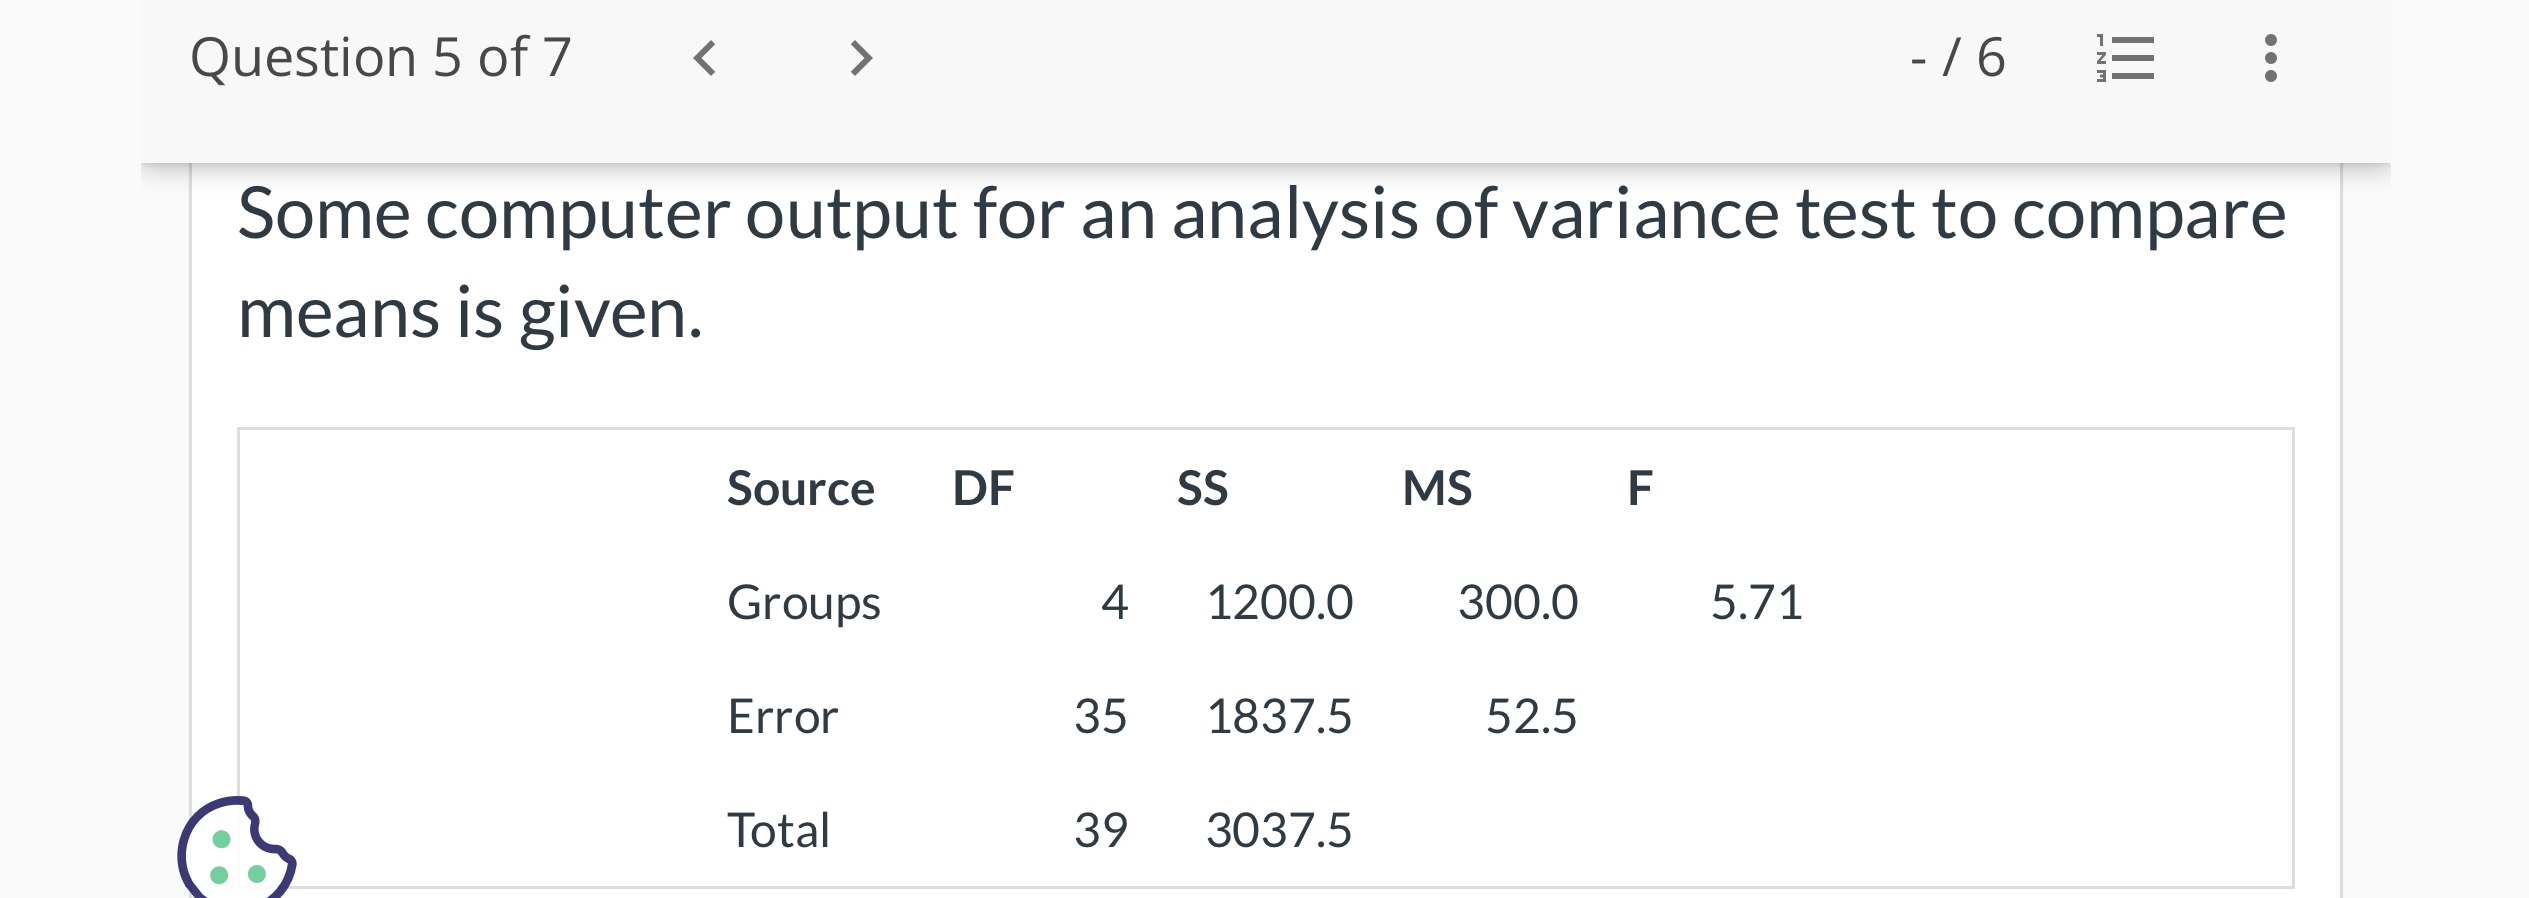
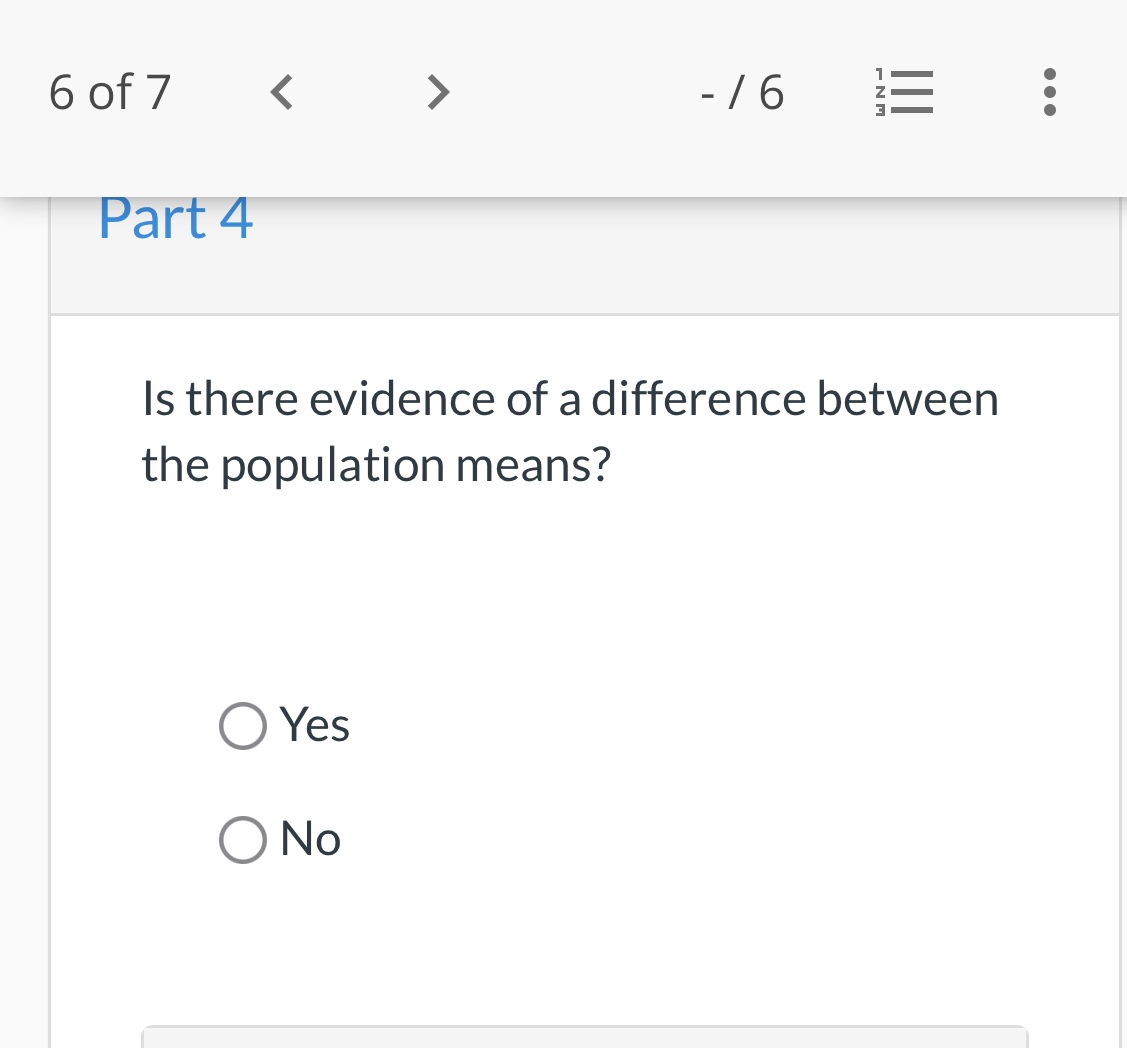
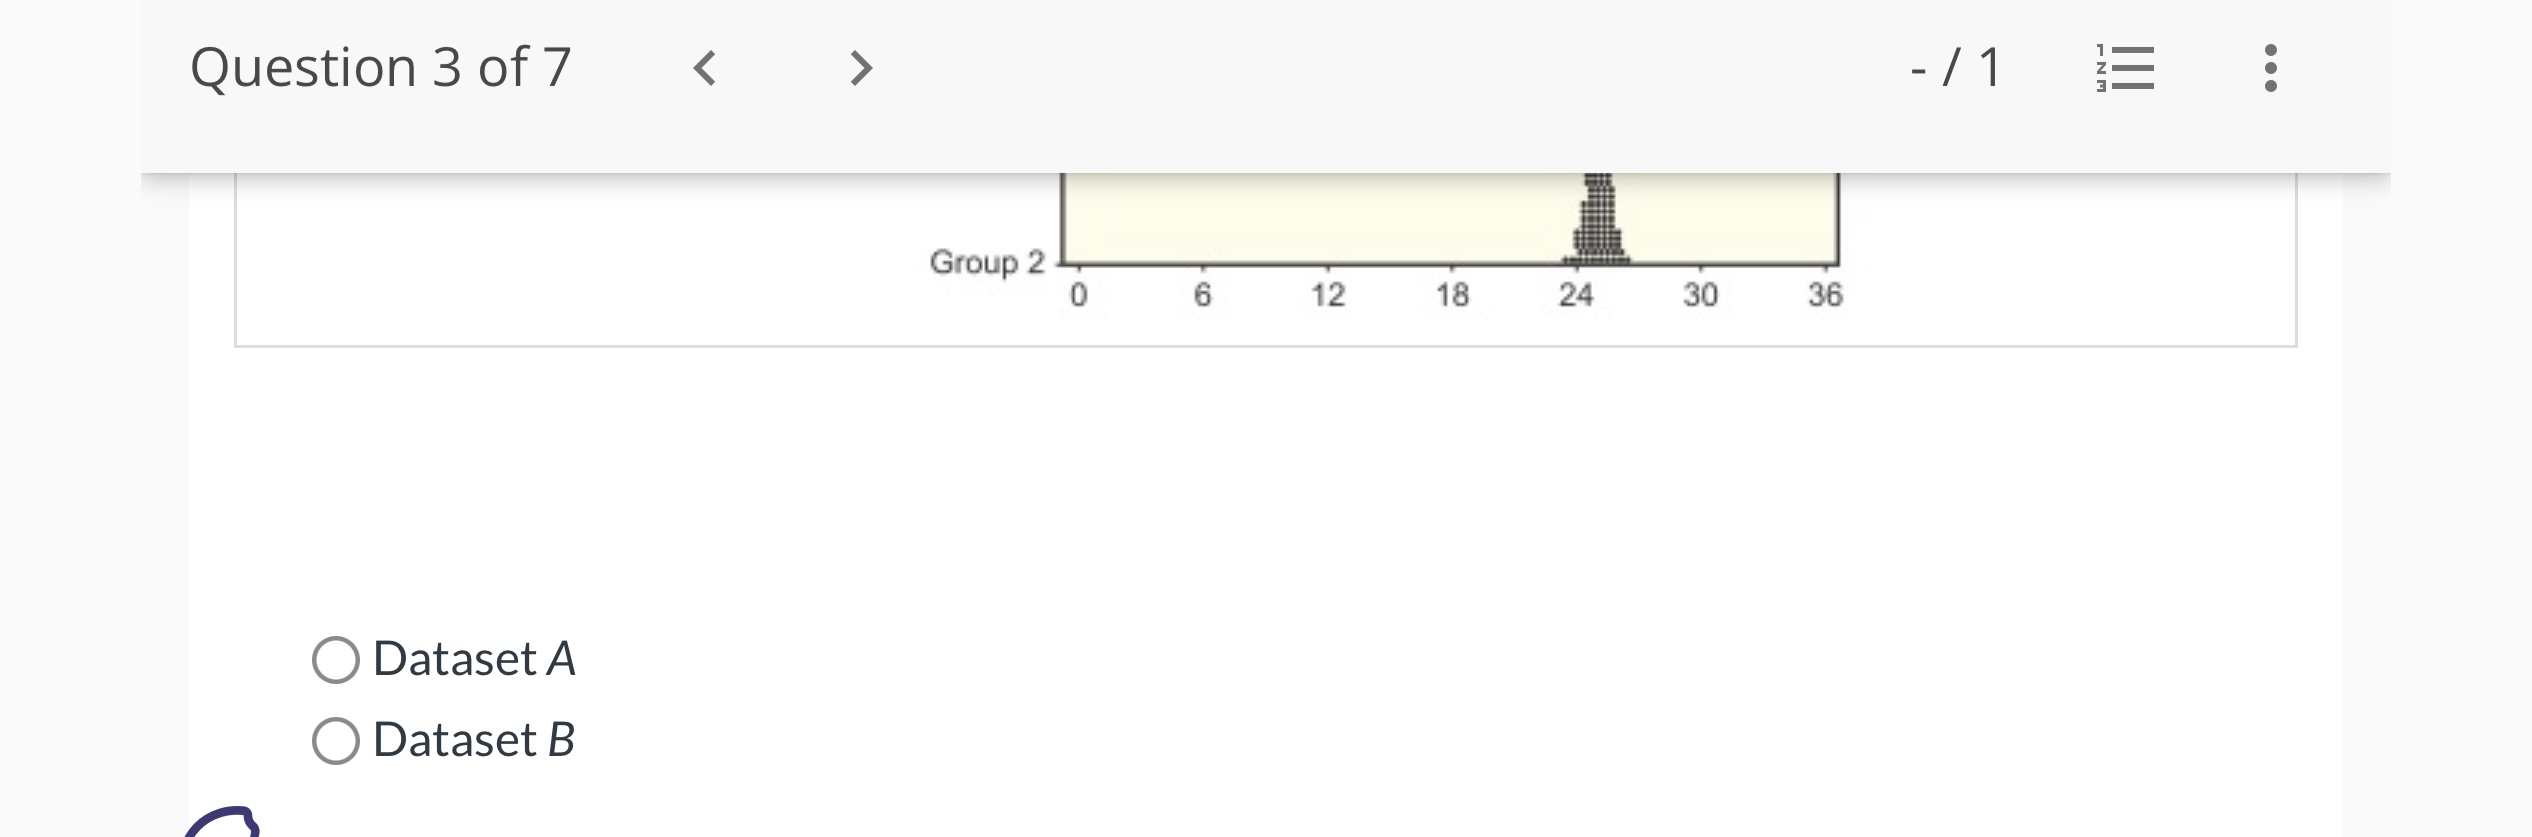
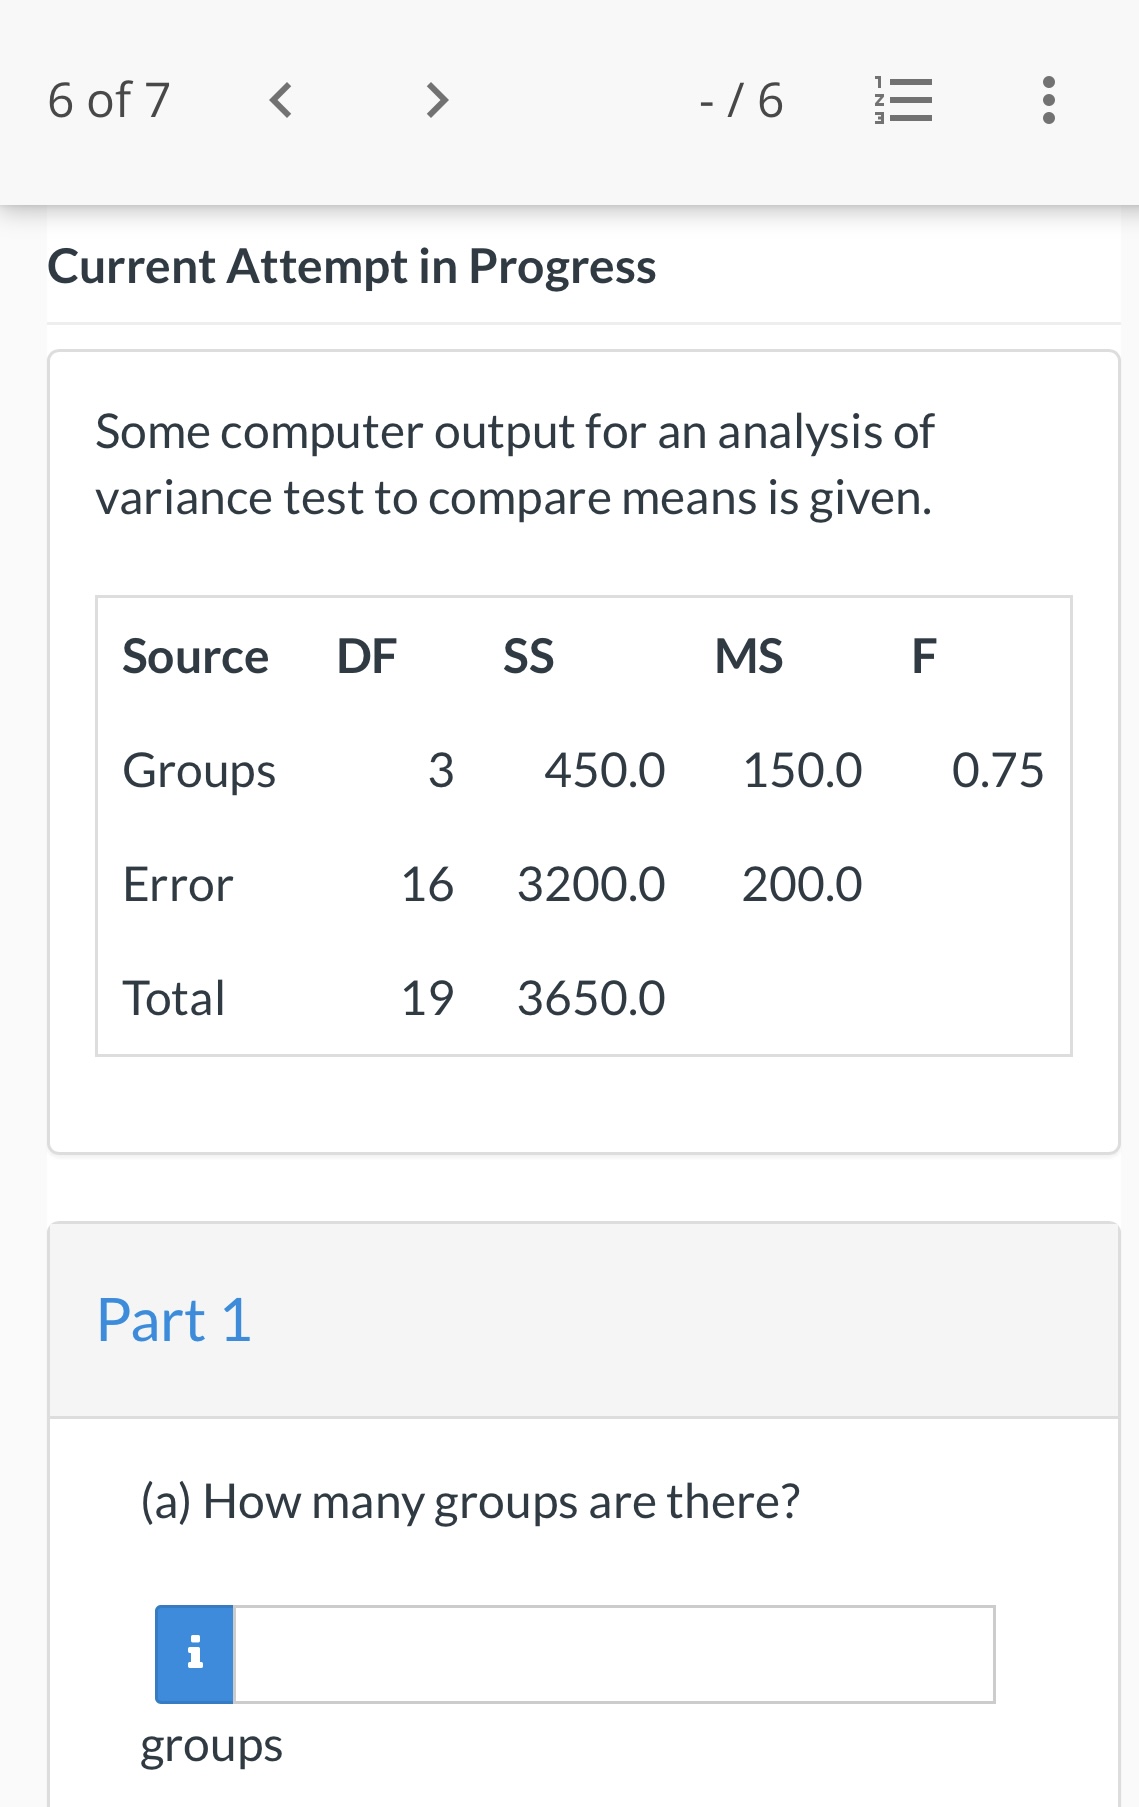
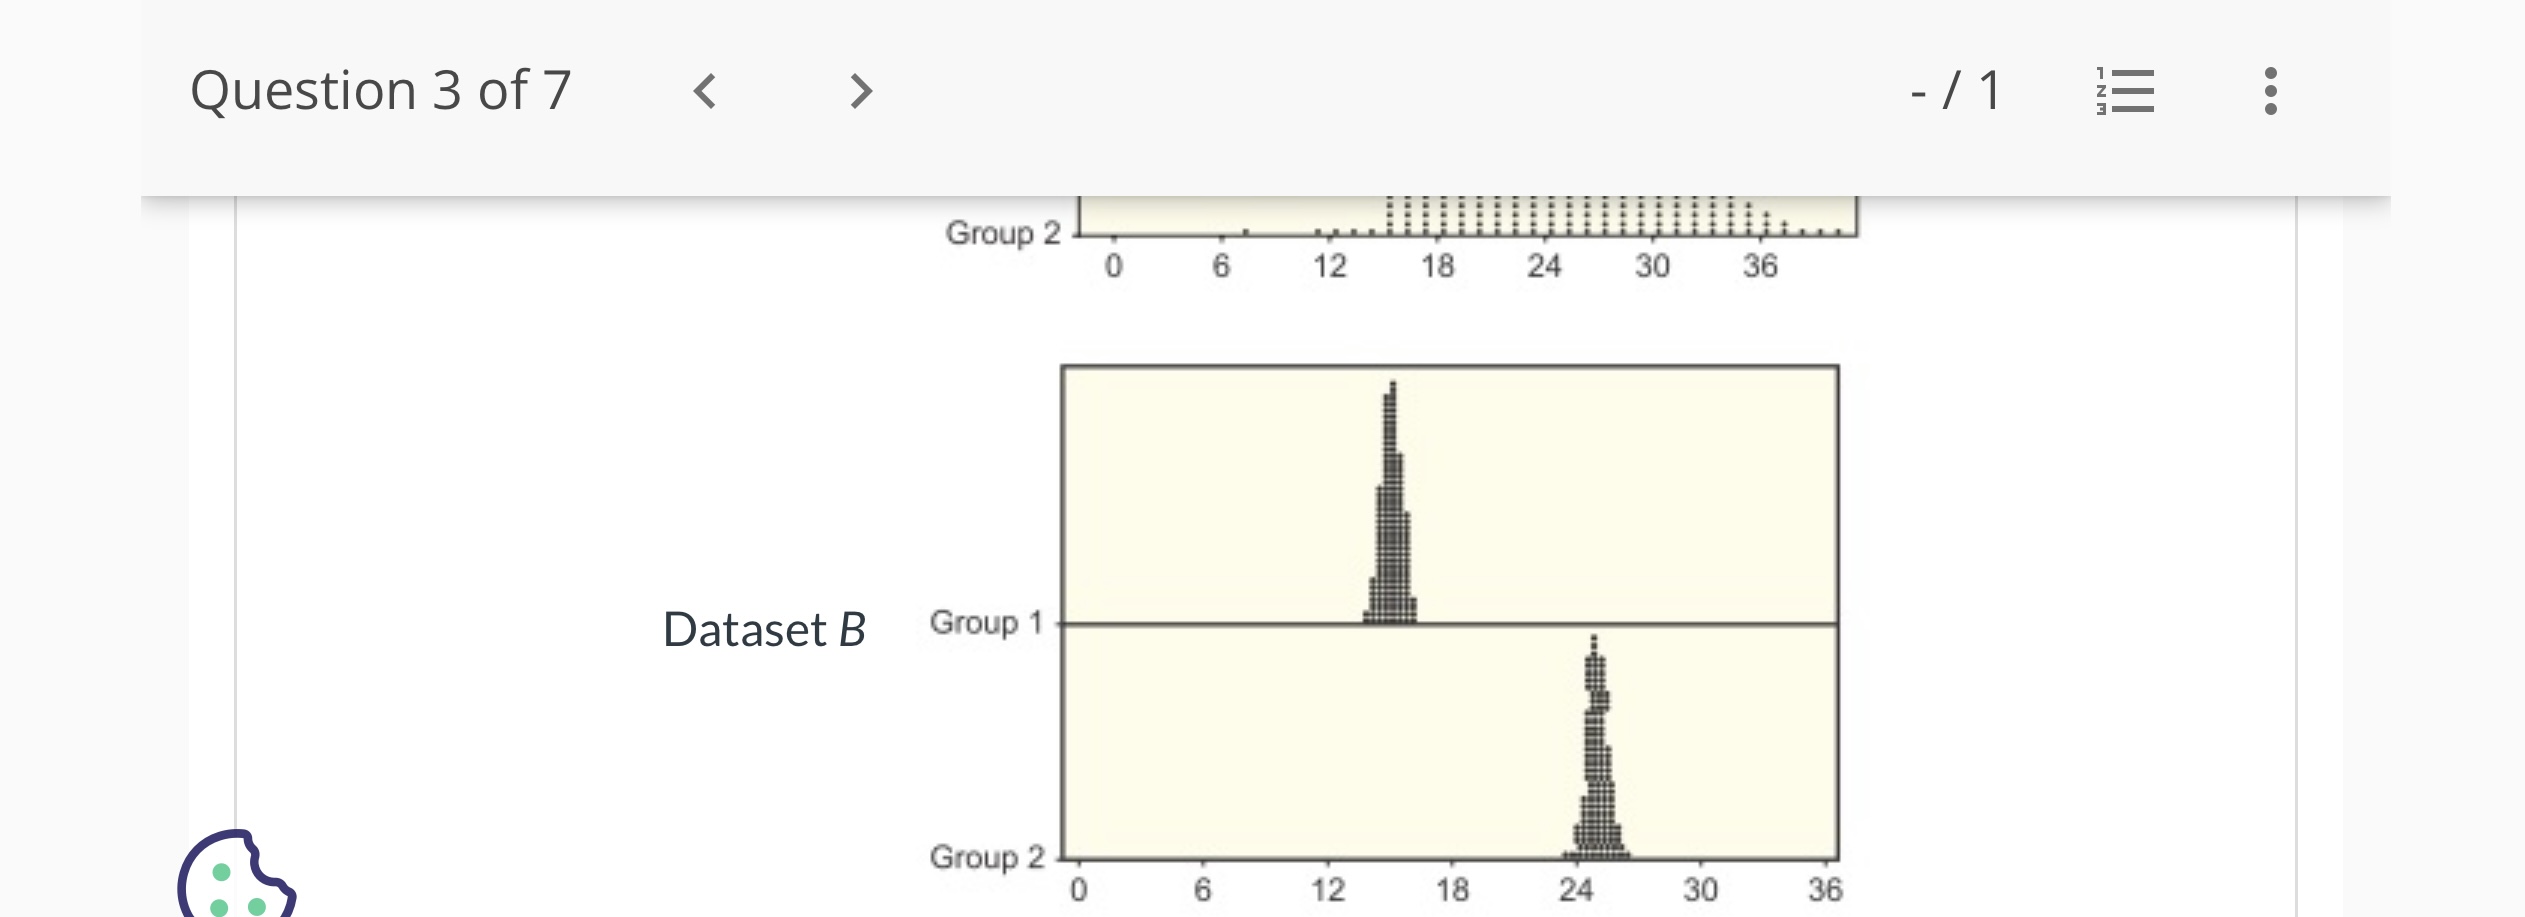
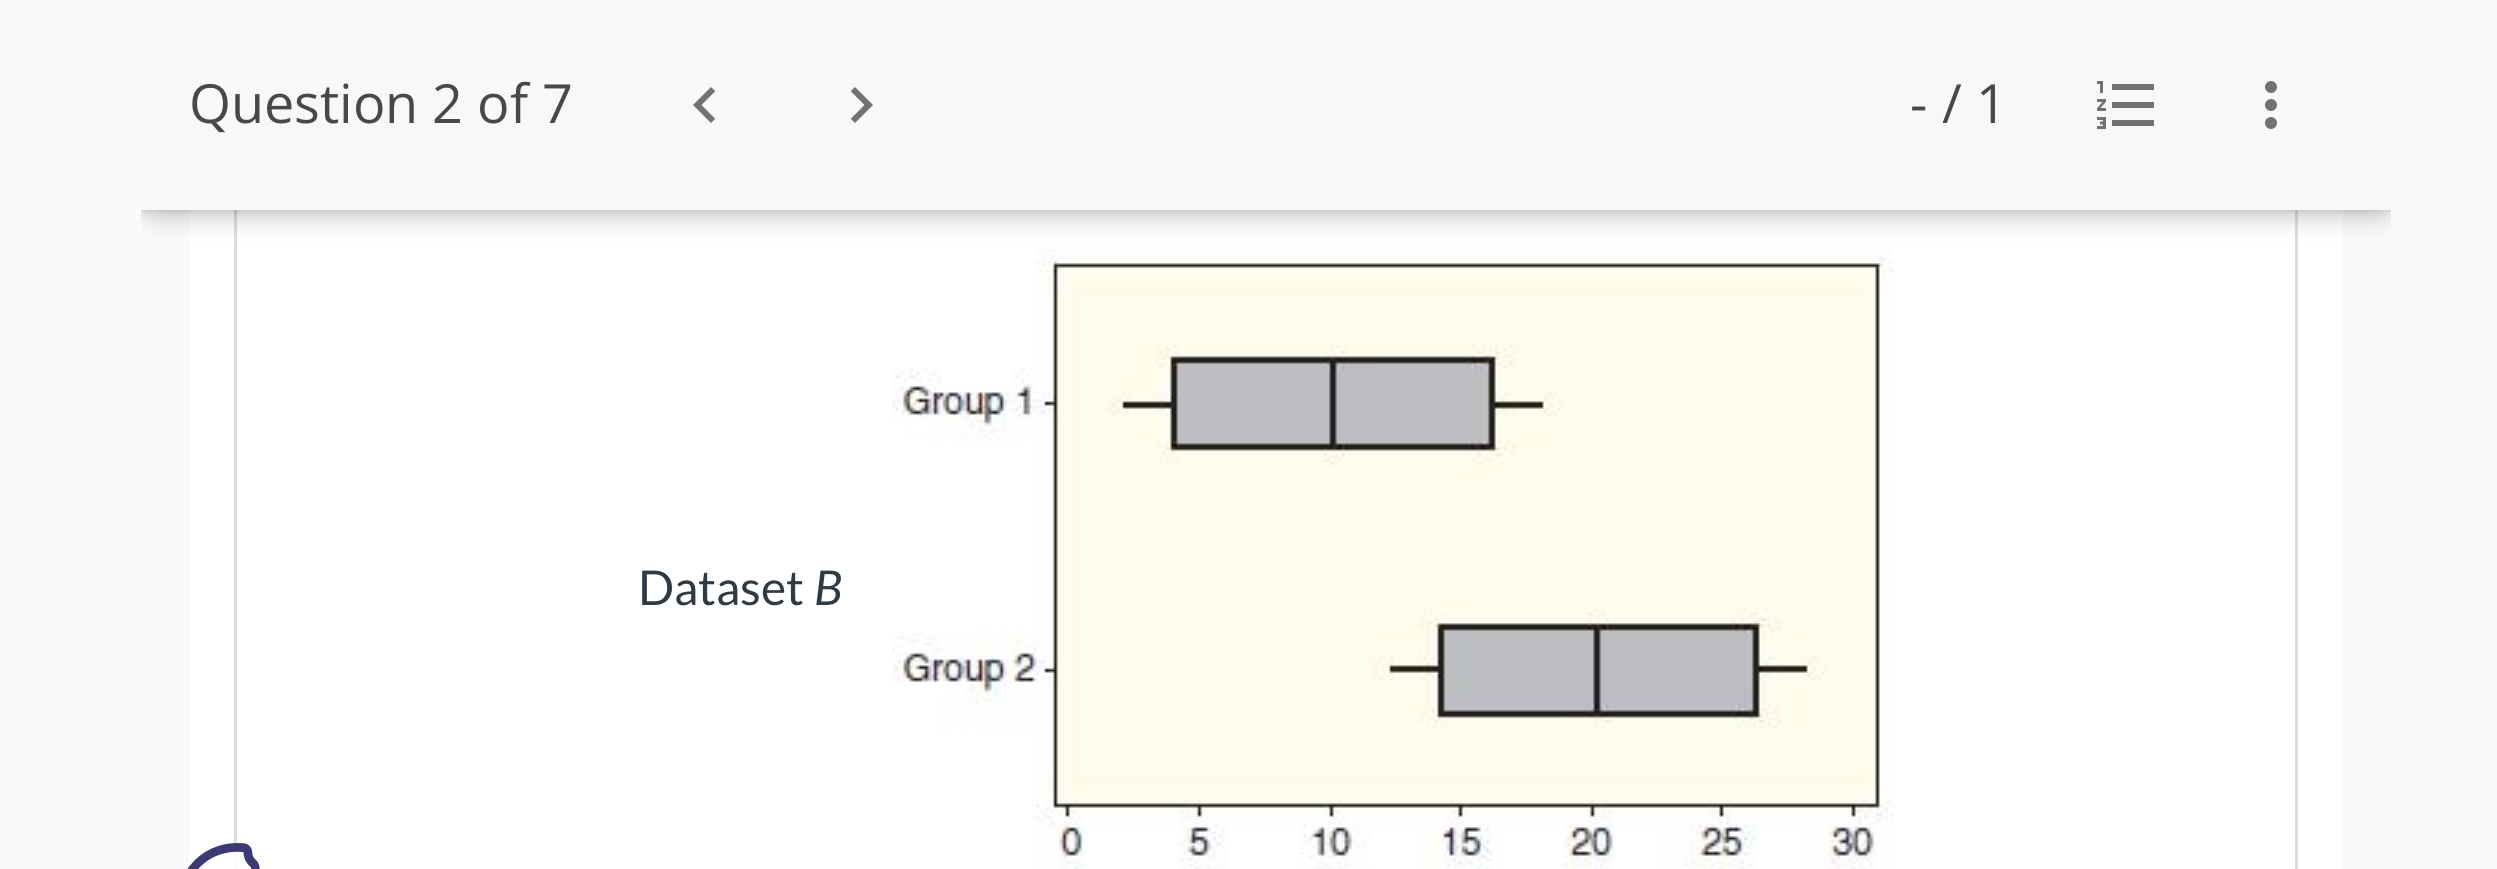
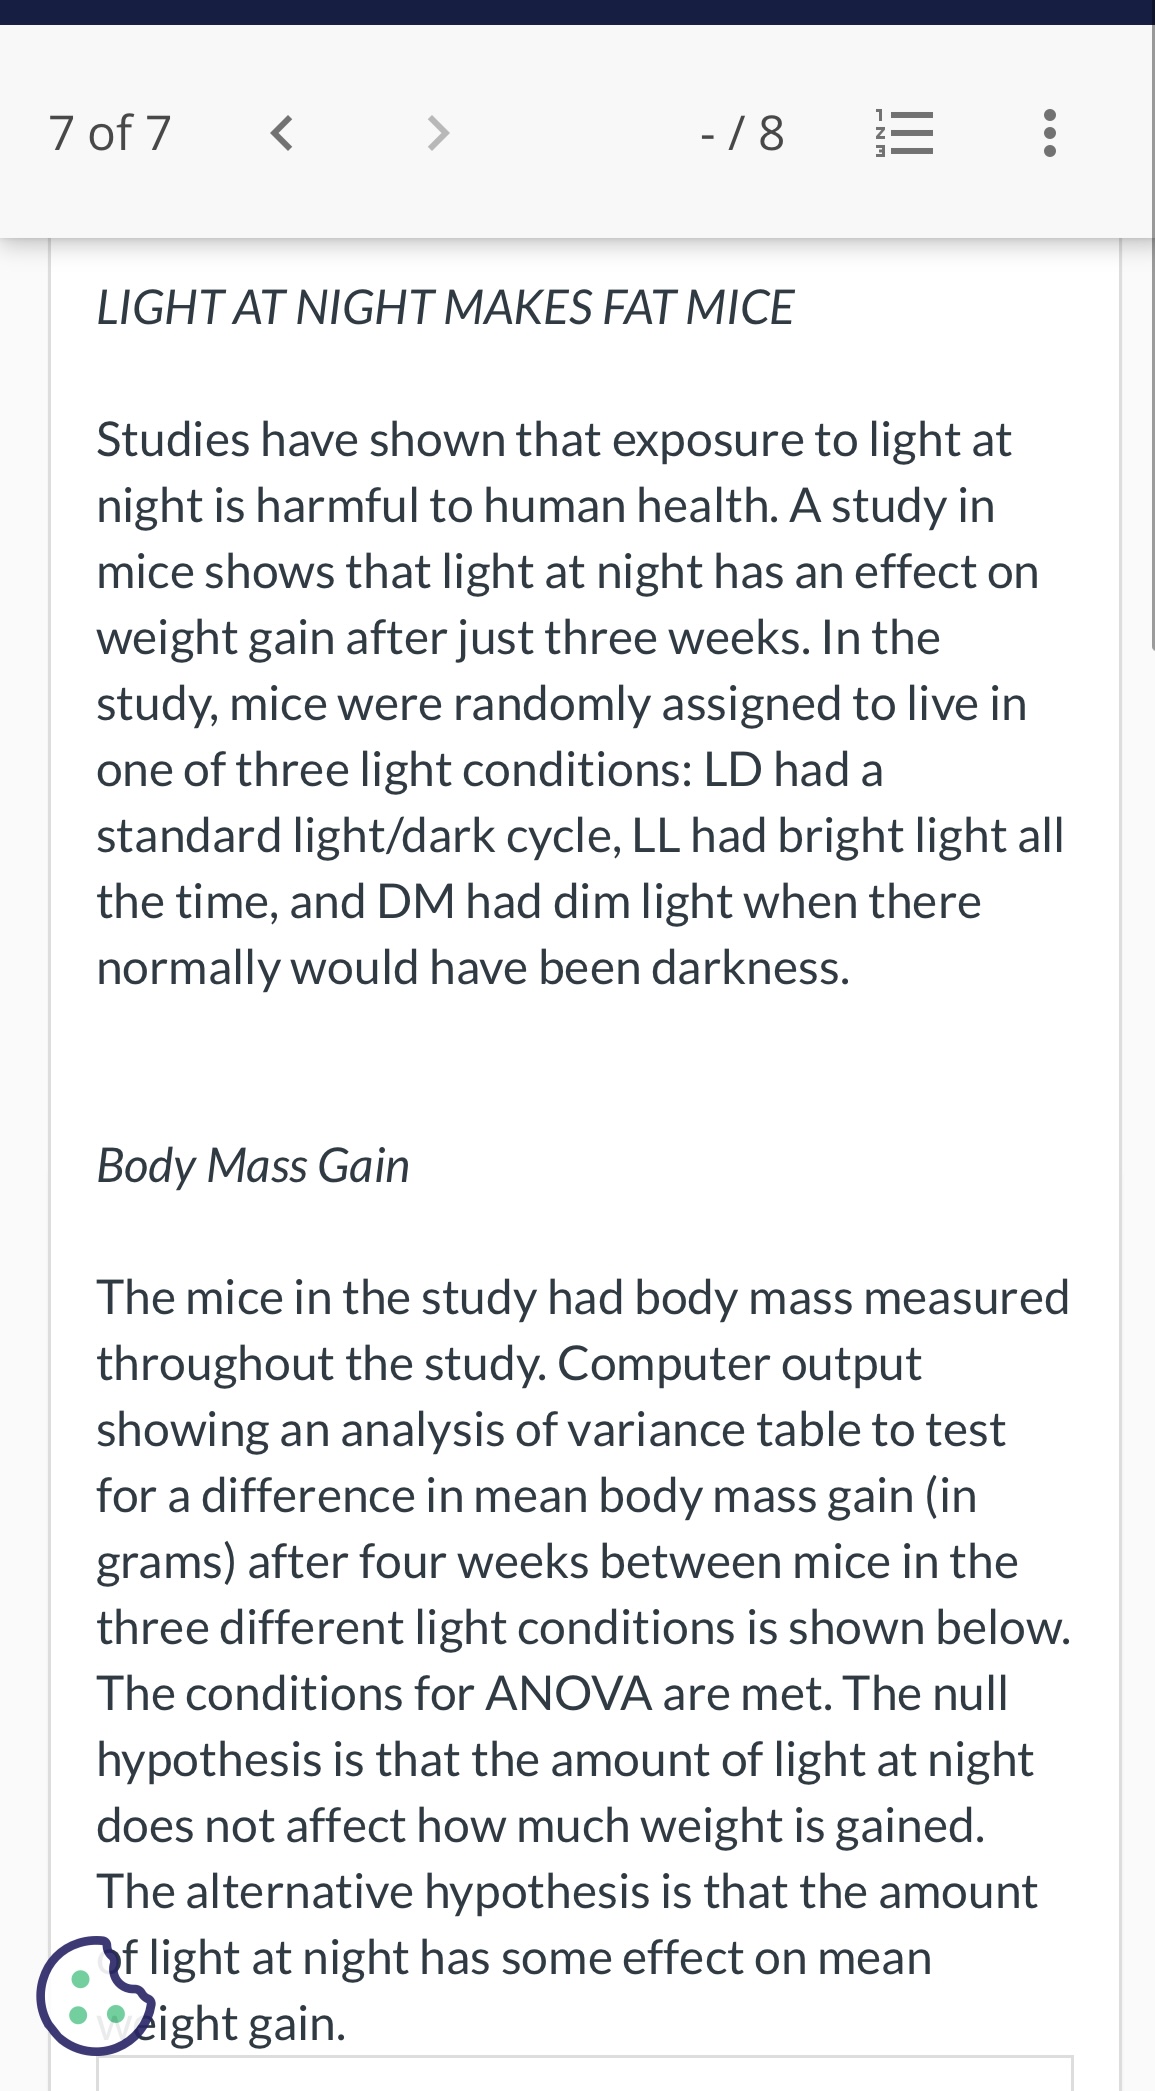
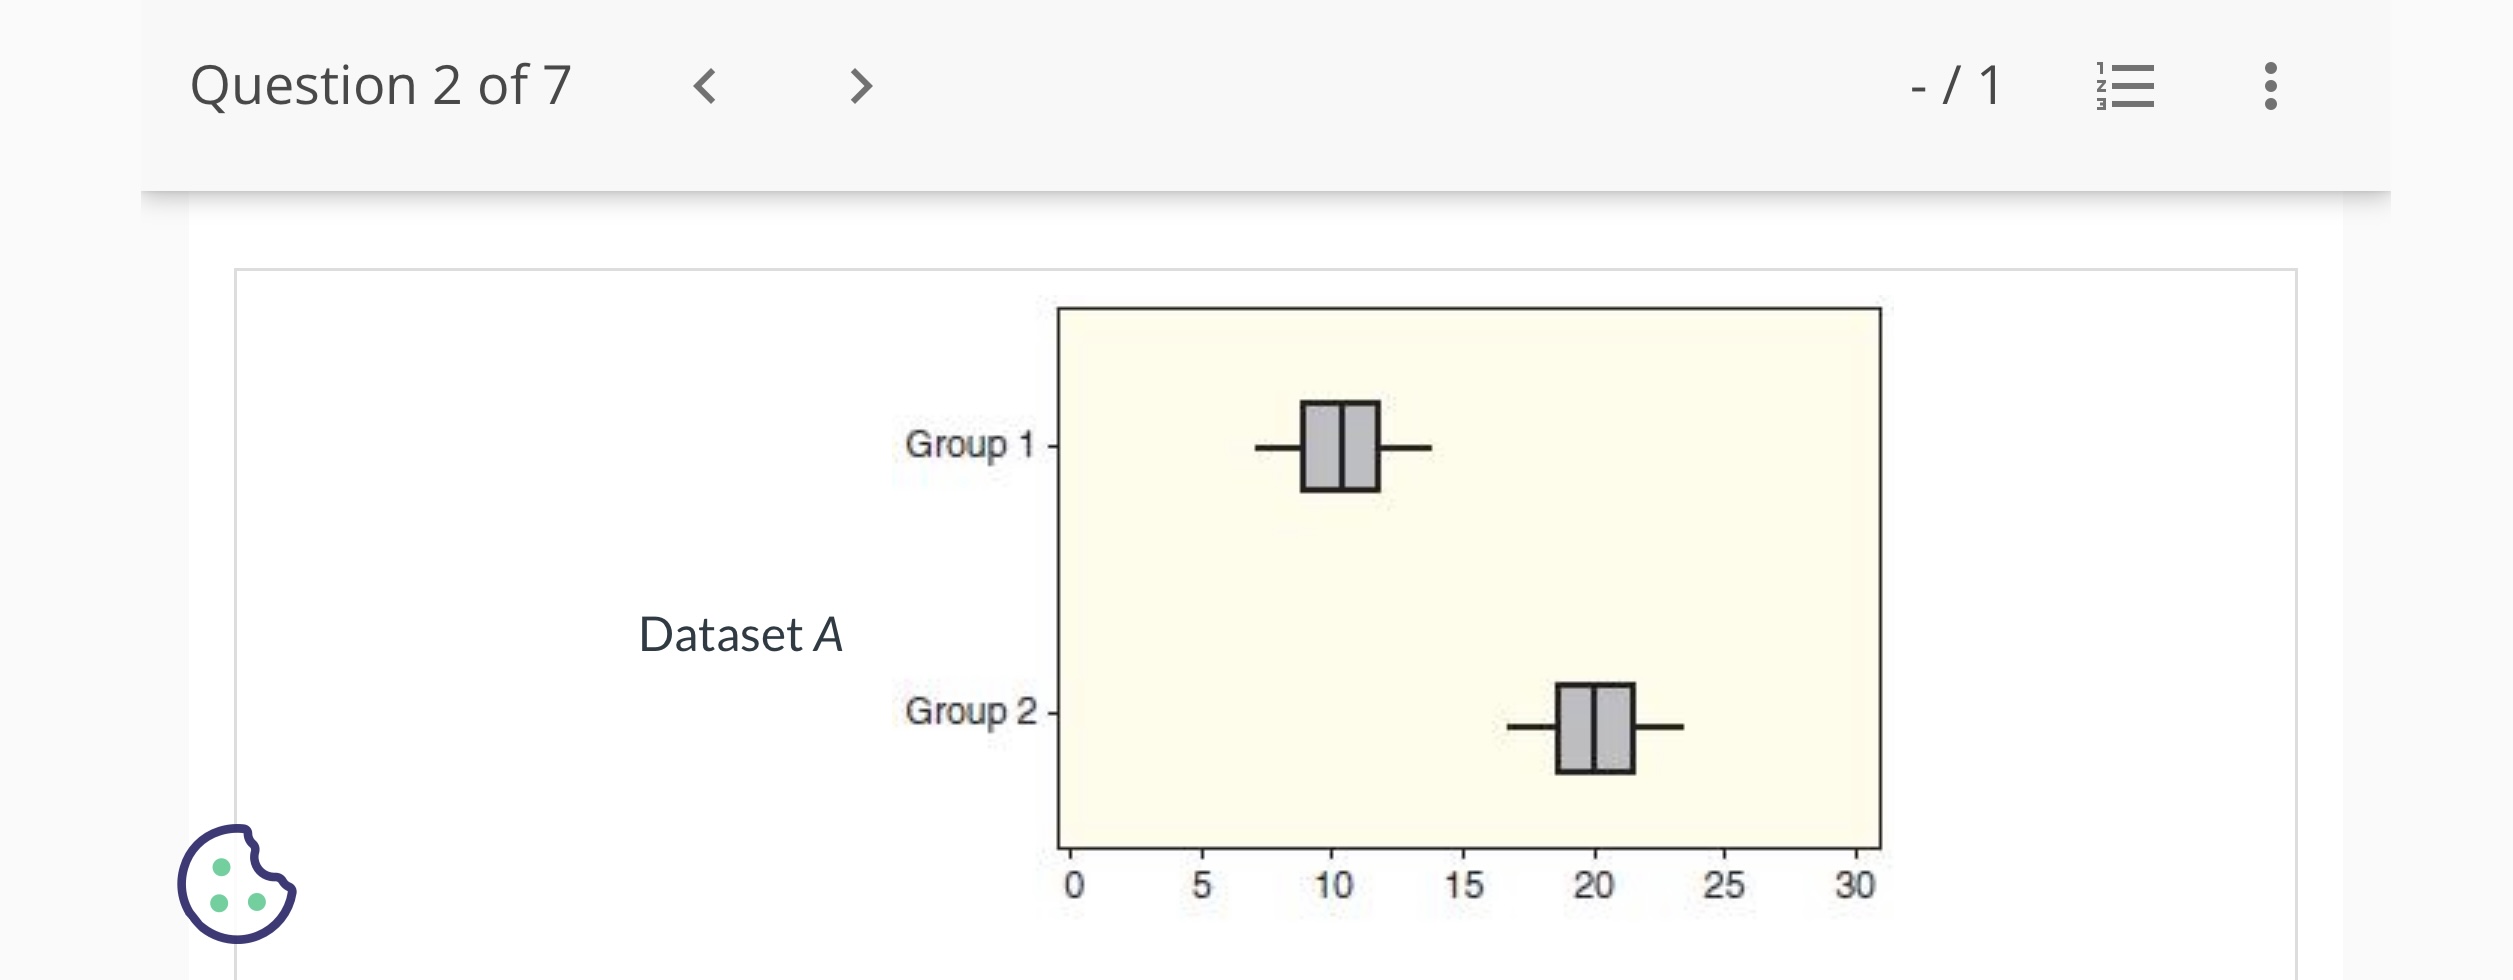
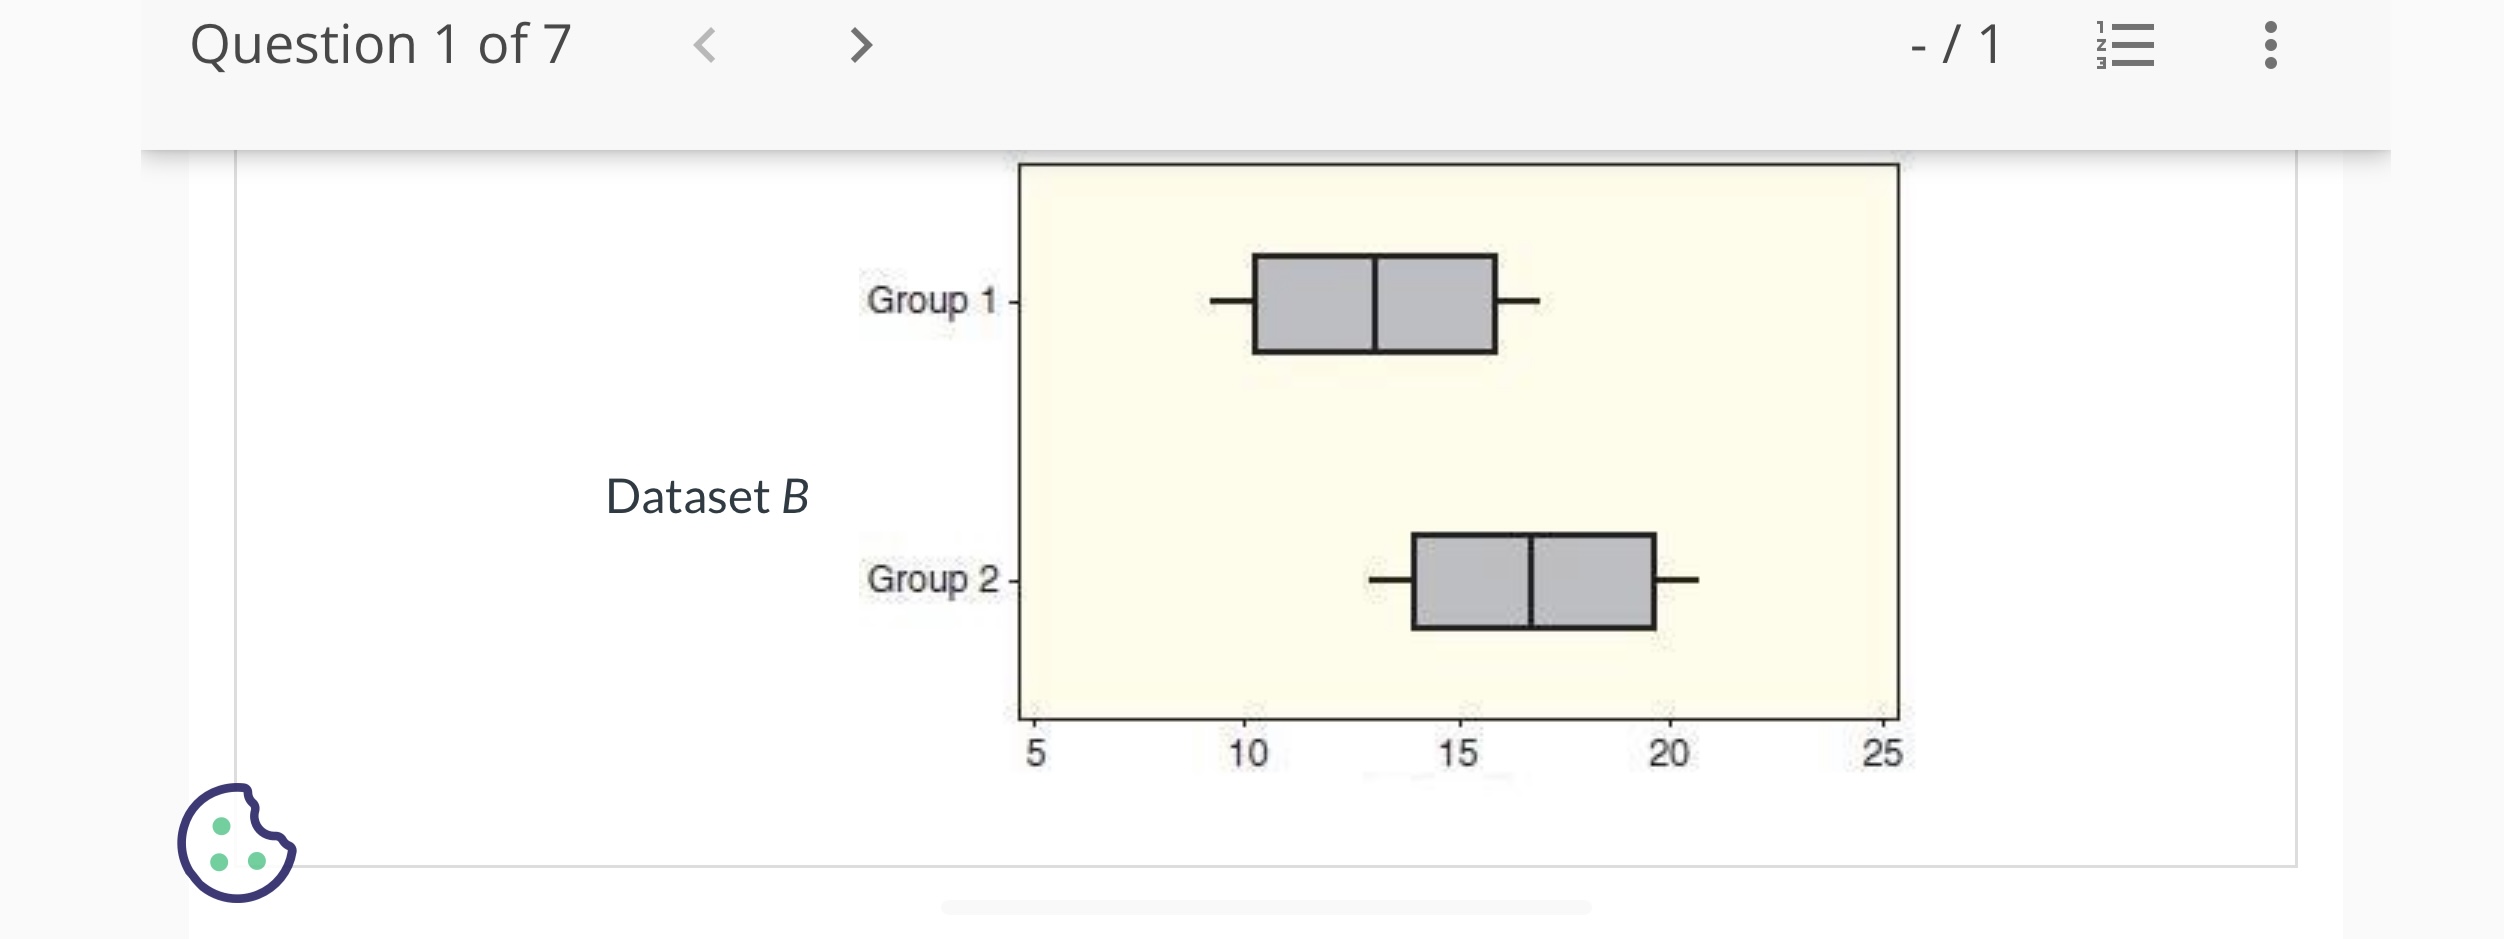
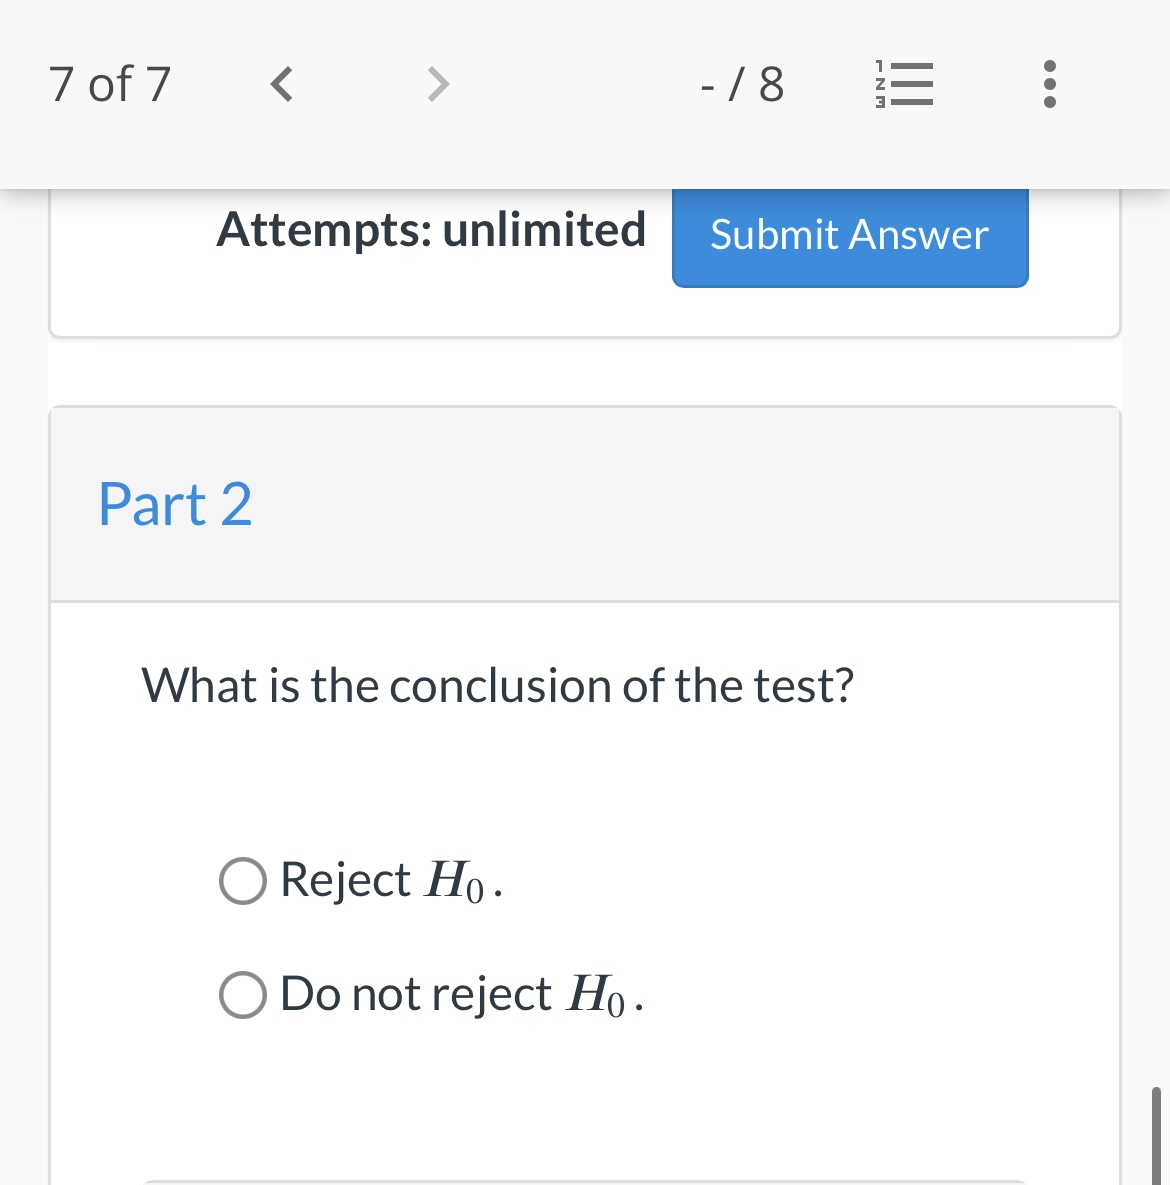
7 of 7 /'| Current Attempt in Progress Two sets of sample data, A and B, are given. Without doing any calculations, indicate in which set of sample data, A or B, there is likely to be stronger evidence of a difference in the two population means. Question 5 of7 (b) What is the pvalue? Round your answer to four decimal places. The pvalue is /6 \fQuestion 4 of 7 > - /12 E . . . Source df SS MS F-statistic Groups i 118 1 Error i 284 i Total i 4027 of 7 - 18 . . . The conditions for ANOVA are met. I he null hypothesis is that the amount of light at night does not affect how much weight is gained. The alternative hypothesis is that the amount of light at night has some effect on mean weight gain. Level N Mean StDev DM 10 7.859 3.009 LD 8 5.926 1.899 LL 9 11.010 2.624 One-way ANOVA: BM Gain versus Light Source DF SS MS F P Light 2 113.08 56.54 8.38 0.002 Error 24 161.84 6.74 Total 26 274.92\fQuestion 5 of 7 - 16 . . . Part 3 (c) Give the conclusion of the test, using a 5% significance level. O Reject Ho. O Do not reject Ho.60f7 -/6 EE Attempts: unlimited Part 2 (b) What is the pvalue? Round your answer to three decimal places. The p-value is \f6 of 7 - / 6 ;: Some computer output for an analysis of variance test to compare means is given. Source DF SS MS F Groups 4 1200.0 300.0 5.71 Error 35 1837.5 52.5 (B Total 39 3037.5 \fQuestion 3 of 7 - /1 E . . . Group 2 0 6 12 18 24 30 36 O Dataset A O Dataset B60f7 -/6 ;: Current Attempt in Progress Some computer output for an analysis of variance test to compare means is given. Source DF 55 MS F Groups 3 450.0 150.0 Error 16 3200.0 200.0 Total 19 3650.0 Part 1 (a) How many groups are there? groups 0.75 Question 1 of7 > /1 Current Attempt in Progress Two sets of sample data, A and B, are given. Without doing any calculations, indicate in which set of sample data, A or B, there is likely to be stronger evidence of a difference in the two population means. Question 5 of 7 > - 16 IE . . . Part 1 (a) How many groups are there? i groupsQuestion 2 of7 /1 Current Attempt in Progress Two sets of sample data, A and B, are given. Without doing any calculations, indicate in which set of sample data, A or B, there is likely to be stronger evidence of a difference in the two population means. Question 3 of 7 - /1 WIN - E . . . Group 2 0 6 12 18 24 30 36 Dataset B Group 1 Group 2 0 6 12 18 24 30 36\fQuestion 4 of7 / 12 E Given below are sample sizes for the groups in a dataset and an outline of an analysis of variance table with some information on the sums of squares. Fill in the missing parts of the table. (Round your answers to two decimal places, if necessary. 70f7 / 6 Is there evidence of a difference between the population means? 7of7
Step by Step Solution
There are 3 Steps involved in it

Get step-by-step solutions from verified subject matter experts