

Question: #7 Please see attached picture for the problem i need help with. Thank you A random sample of n1 2 16 communities in western Kansas
#7
Please see attached picture for the problem i need help with. Thank you
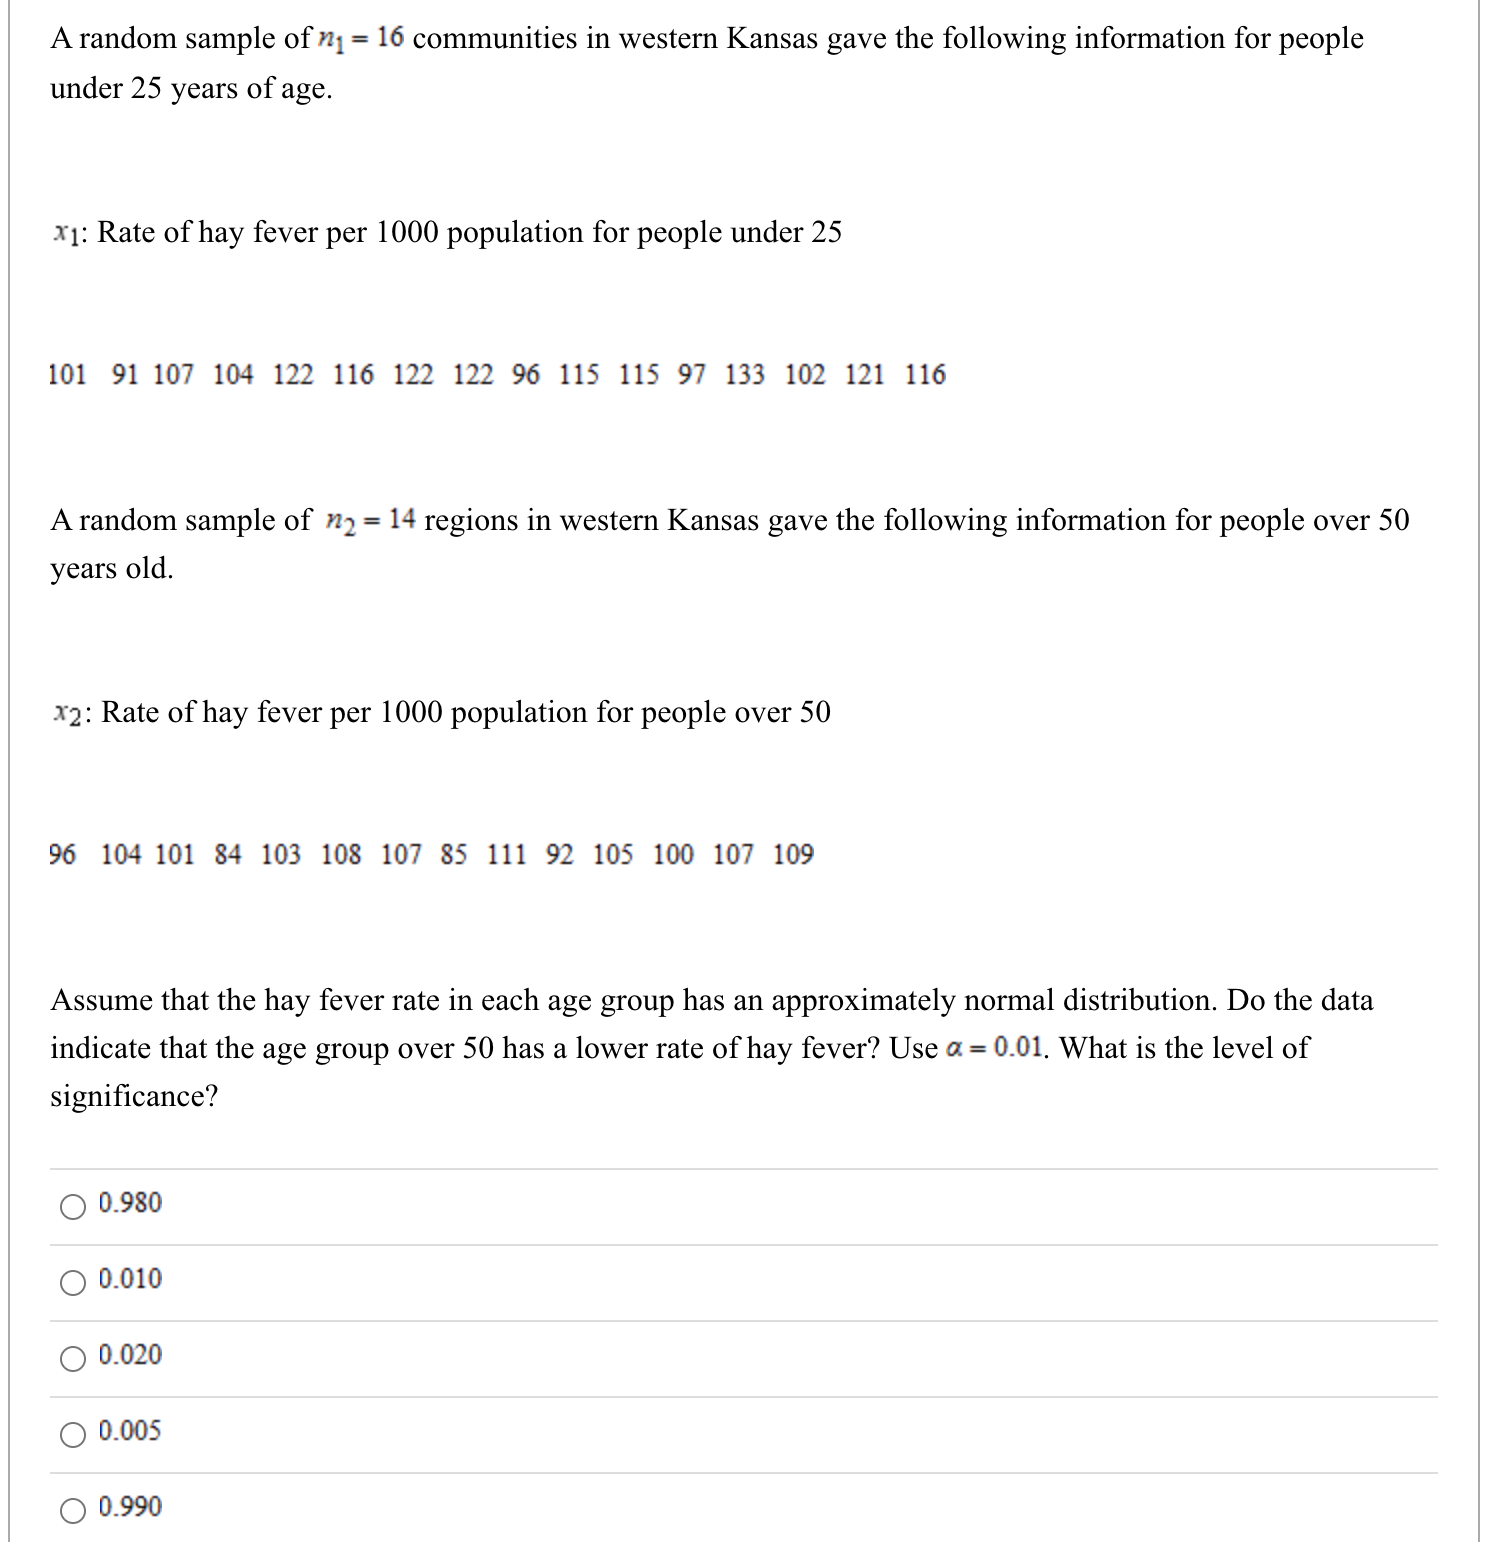
A random sample of n1 2 16 communities in western Kansas gave the following information for people under 25 years of age. I]: Rate of hay fever per 1000 population for people under 25 101 91 107 104 122 116 122 122 96 115 115 97 133 102 121 116 A random sample of R2 - 14 regions in western Kansas gave the following information for people over 50 years old. 12: Rate of hay fever per 1000 population for people over 50 96 104101 84 103 108 107 85 111 92 105 100 107 109 Assume that the hay fever rate in each age group has an approximately normal distribution. Do the data indicate that the age group over 50 has a lower rate of hay fever? Use a - 0.01. What is the level of signicance? 0 0.980 O 0.010 O 0.000 O 0.005 O 0.990
Step by Step Solution
There are 3 Steps involved in it

Get step-by-step solutions from verified subject matter experts