

Question: 7. Sound financial analysis involves more than just calculating numbers. The American Association of Individual Investors suggests that investors consider the qualitative factors below when
 7. Sound financial analysis involves more than just calculating numbers. The American Association of Individual Investors suggests that investors consider the qualitative factors below when evaluating a company. Answer the questions for River Community Hospital. When there is insufficient information in the case to answer a question, briefly speculate about why the question might be relevant to the hospital. - Are the companys revenues tied to one key customer? - To what extent are the companys revenues tied to one key product? - To what extent does the company rely on a single supplier? (Hint: Physicians and nurses are key suppliers of labor to a hospital.) - What about the competition? - What are the companys future prospects? - How does the legal and regulatory environment affect the company? 8. Based on the limited amount of information provided in the case, what are your top three or four recommendations to the board? 9. In your opinion, what are three key learning points from this case?
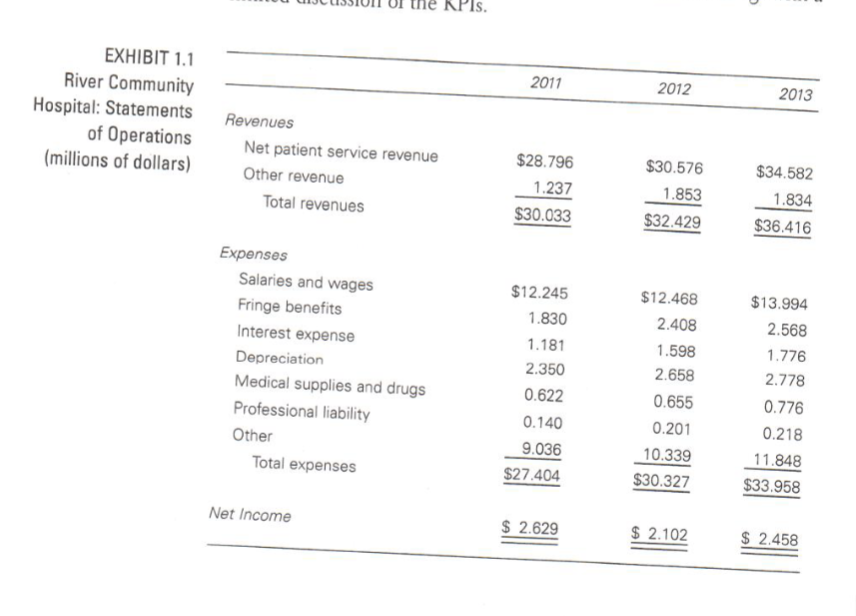
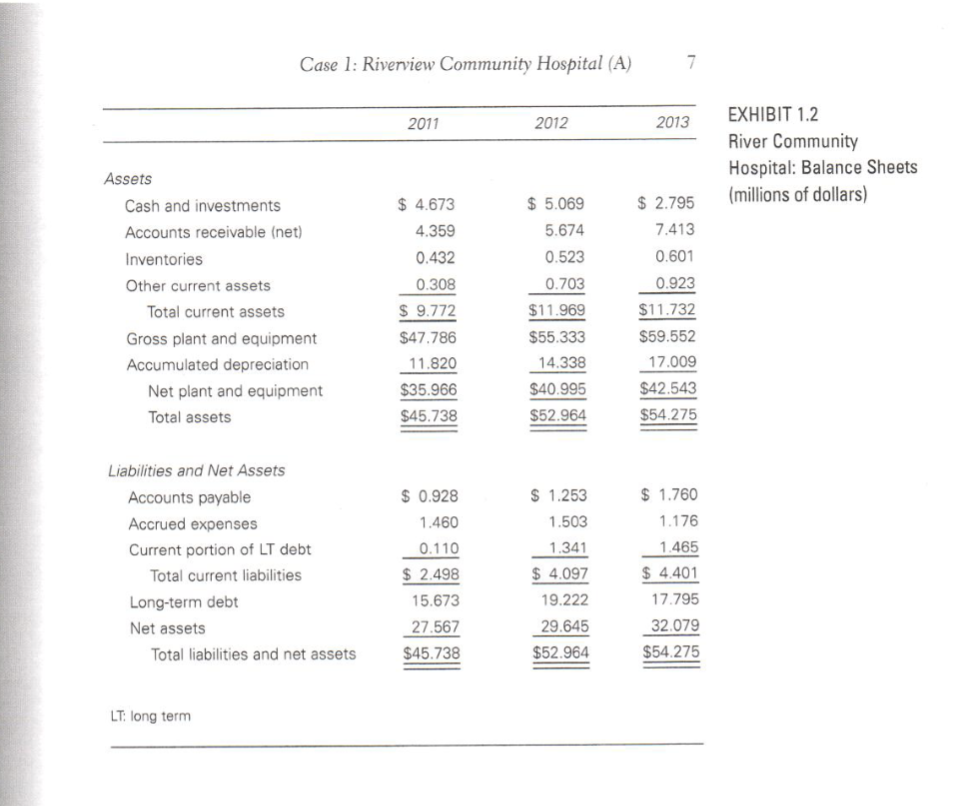
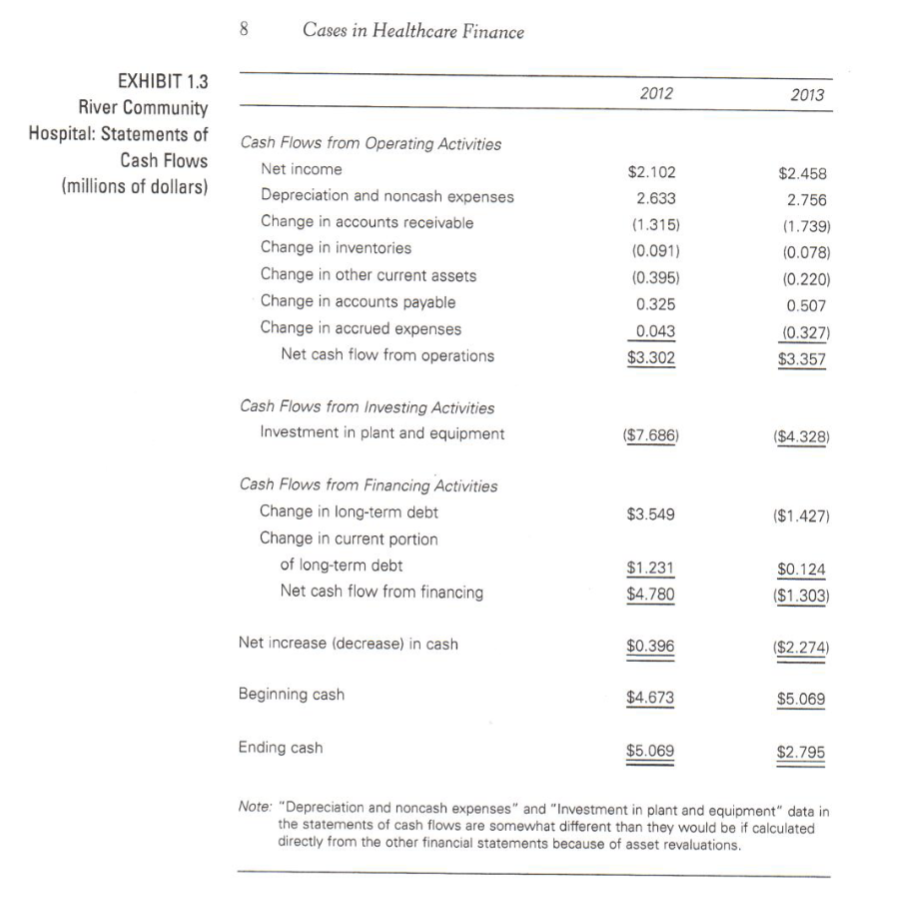
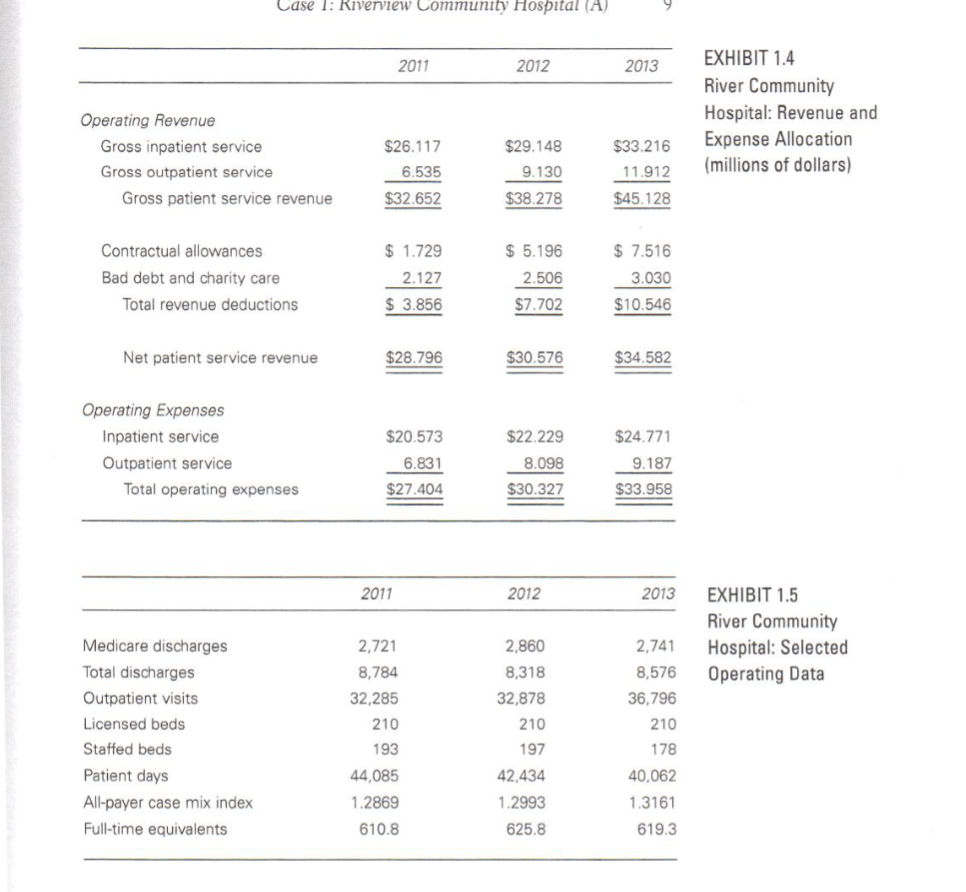
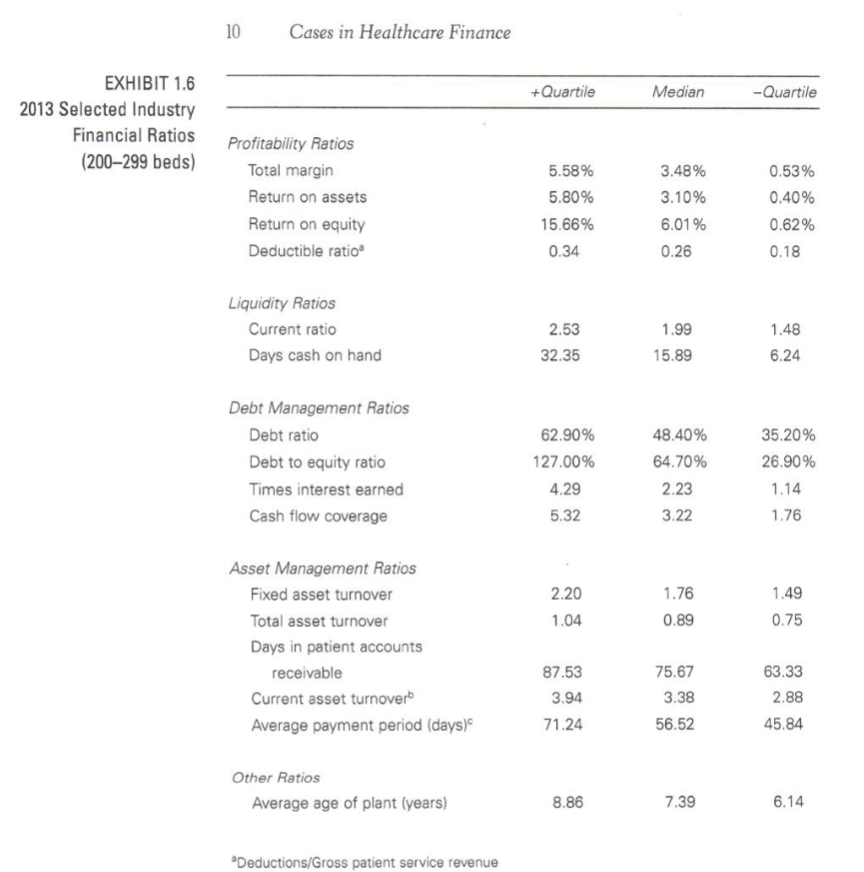
KPIs. 2011 2012 2013 EXHIBIT 1.1 River Community Hospital: Statements of Operations (millions of dollars) Revenues Net patient service revenue Other revenue Total revenues $28.796 1.237 $30.033 $30.576 1.853 $32.429 $34.582 1.834 $36.416 Expenses Salaries and wages Fringe benefits Interest expense Depreciation Medical supplies and drugs Professional liability Other Total expenses $12.245 1.830 1.181 2.350 0.622 0.140 9.036 $27.404 $12.468 2.408 1.598 2.658 0.655 0.201 10.339 $30.327 $13.994 2.568 1.776 2.778 0.776 0.218 11.848 $33.958 Net Income $ 2.629 $ 2.102 $ 2.458 Case 1: Riverview Community Hospital (A) 7 2011 2012 2013 EXHIBIT 1.2 River Community Hospital: Balance Sheets (millions of dollars) Assets Cash and investments Accounts receivable (net) Inventories Other current assets Total current assets Gross plant and equipment Accumulated depreciation Net plant and equipment Total assets $ 4.673 4.359 0.432 0.308 $ 9.772 $47.786 11.820 $35.966 $45.738 $ 5.069 5.674 0.523 0.703 $11.969 $55.333 14.338 $40.995 $52.964 $ 2.795 7.413 0.601 0.923 $11.732 $59.552 17.009 $42.543 $54.275 Liabilities and Net Assets Accounts payable Accrued expenses Current portion of LT debt Total current liabilities Long-term debt Net assets Total liabilities and net assets $ 0.928 1.460 0.110 $ 2.498 15.673 27.567 $45.738 $ 1.253 1.503 1.341 $ 4.097 19.222 29.645 $52.964 $ 1.760 1.176 1.465 $ 4.401 17.795 32.079 $54.275 LT: long term 8 Cases in Healthcare Finance 2012 2013 EXHIBIT 1.3 River Community Hospital: Statements of Cash Flows (millions of dollars) Cash Flows from Operating Activities Net income Depreciation and noncash expenses Change in accounts receivable Change in inventories Change in other current assets Change in accounts payable Change in accrued expenses Net cash flow from operations $2.102 2.633 (1.315) (0.091) (0.395) 0.325 0.043 $3.302 $2.458 2.756 (1.739) (0.078) (0.220) 0.507 (0.327) $3.357 Cash Flows from Investing Activities Investment in plant and equipment ($7.686) ($4.328) $3.549 ($1.427) Cash Flows from Financing Activities Change in long-term debt Change in current portion of long-term debt Net cash flow from financing $1.231 $4.780 $0.124 ($1.303) Net increase (decrease) in cash $0.396 ($2.274) Beginning cash $4.673 $5.069 Ending cash $5.069 $2.795 Note: "Depreciation and noncash expenses" and "Investment in plant and equipment" data in the statements of cash flows are somewhat different than they would be if calculated directly from the other financial statements because of asset revaluations. Case 1: Riverview Community Hospital (A) 2011 2012 2013 EXHIBIT 1.4 River Community Hospital: Revenue and Expense Allocation (millions of dollars) $26.117 Operating Revenue Gross inpatient service Gross outpatient service Gross patient service revenue $33.216 $29.148 9.130 6.535 11.912 $45.128 $32.652 $38.278 Contractual allowances Bad debt and charity care Total revenue deductions $ 1.729 2.127 $ 3.856 $ 5.196 2.506 $7.702 $ 7.516 3.030 $10.546 Net patient service revenue $28.796 $30.576 $34.582 $22.229 Operating Expenses Inpatient service Outpatient service Total operating expenses $20.573 6.831 8.098 $30.327 $24.771 9.187 $33.958 $27.404 2011 2012 2013 EXHIBIT 1.5 River Community Hospital: Selected Operating Data Medicare discharges Total discharges Outpatient visits Licensed beds Staffed beds Patient days All-payer case mix index Full-time equivalents 2,721 8,784 32,285 210 193 44,085 1.2869 610.8 2,860 8,318 32,878 210 197 2,741 8,576 36,796 210 178 40,062 42,434 1.2993 625.8 1.3161 619.3 10 Cases in Healthcare Finance +Quartile Median -Quartile EXHIBIT 1.6 2013 Selected Industry Financial Ratios (200-299 beds) Profitability Ratios Total margin Return on assets Return on equity Deductible ratio 5.58% 5.80% 15.66% 0.34 3.48% 3.10% 6.01% 0.26 0.53% 0.40% 0.62% 0.18 Liquidity Ratios Current ratio Days cash on hand 2.53 32.35 1.99 15.89 1.48 6.24 Debt Management Ratios Debt ratio Debt to equity ratio Times interest earned Cash flow coverage 62.90% 127.00% 4.29 5.32 48.40% 64.70% 2.23 3.22 35.20% 26.90% 1.14 1.76 1.76 2.20 1.04 1.49 0.75 0.89 Asset Management Ratios Fixed asset turnover Total asset turnover Days in patient accounts receivable Current asset turnoverb Average payment period (days) 87.53 3.94 71.24 75.67 3.38 56.52 63.33 2.88 45.84 Other Ratios Average age of plant (years) 8.86 7.39 6.14 Deductions/Gross patient service revenue 10 Cases in Healthcare Finance +Quartile Median -Quartile EXHIBIT 1.6 2013 Selected Industry Financial Ratios (200-299 beds) Profitability Ratios Total margin Return on assets Return on equity Deductible ratio 5.58% 5.80% 15.66% 0.34 3.48% 3.10% 6.01% 0.26 0.53% 0.40% 0.62% 0.18 Liquidity Ratios Current ratio Days cash on hand 2.53 32.35 1.99 15.89 1.48 6.24 Debt Management Ratios Debt ratio Debt to equity ratio Times interest earned Cash flow coverage 62.90% 127.00% 4.29 5.32 48.40% 64.70% 2.23 3.22 35.20% 26.90% 1.14 1.76 1.76 2.20 1.04 1.49 0.75 0.89 Asset Management Ratios Fixed asset turnover Total asset turnover Days in patient accounts receivable Current asset turnoverb Average payment period (days) 87.53 3.94 71.24 75.67 3.38 56.52 63.33 2.88 45.84 Other Ratios Average age of plant (years) 8.86 7.39 6.14 Deductions/Gross patient service revenue KPIs. 2011 2012 2013 EXHIBIT 1.1 River Community Hospital: Statements of Operations (millions of dollars) Revenues Net patient service revenue Other revenue Total revenues $28.796 1.237 $30.033 $30.576 1.853 $32.429 $34.582 1.834 $36.416 Expenses Salaries and wages Fringe benefits Interest expense Depreciation Medical supplies and drugs Professional liability Other Total expenses $12.245 1.830 1.181 2.350 0.622 0.140 9.036 $27.404 $12.468 2.408 1.598 2.658 0.655 0.201 10.339 $30.327 $13.994 2.568 1.776 2.778 0.776 0.218 11.848 $33.958 Net Income $ 2.629 $ 2.102 $ 2.458 Case 1: Riverview Community Hospital (A) 7 2011 2012 2013 EXHIBIT 1.2 River Community Hospital: Balance Sheets (millions of dollars) Assets Cash and investments Accounts receivable (net) Inventories Other current assets Total current assets Gross plant and equipment Accumulated depreciation Net plant and equipment Total assets $ 4.673 4.359 0.432 0.308 $ 9.772 $47.786 11.820 $35.966 $45.738 $ 5.069 5.674 0.523 0.703 $11.969 $55.333 14.338 $40.995 $52.964 $ 2.795 7.413 0.601 0.923 $11.732 $59.552 17.009 $42.543 $54.275 Liabilities and Net Assets Accounts payable Accrued expenses Current portion of LT debt Total current liabilities Long-term debt Net assets Total liabilities and net assets $ 0.928 1.460 0.110 $ 2.498 15.673 27.567 $45.738 $ 1.253 1.503 1.341 $ 4.097 19.222 29.645 $52.964 $ 1.760 1.176 1.465 $ 4.401 17.795 32.079 $54.275 LT: long term 8 Cases in Healthcare Finance 2012 2013 EXHIBIT 1.3 River Community Hospital: Statements of Cash Flows (millions of dollars) Cash Flows from Operating Activities Net income Depreciation and noncash expenses Change in accounts receivable Change in inventories Change in other current assets Change in accounts payable Change in accrued expenses Net cash flow from operations $2.102 2.633 (1.315) (0.091) (0.395) 0.325 0.043 $3.302 $2.458 2.756 (1.739) (0.078) (0.220) 0.507 (0.327) $3.357 Cash Flows from Investing Activities Investment in plant and equipment ($7.686) ($4.328) $3.549 ($1.427) Cash Flows from Financing Activities Change in long-term debt Change in current portion of long-term debt Net cash flow from financing $1.231 $4.780 $0.124 ($1.303) Net increase (decrease) in cash $0.396 ($2.274) Beginning cash $4.673 $5.069 Ending cash $5.069 $2.795 Note: "Depreciation and noncash expenses" and "Investment in plant and equipment" data in the statements of cash flows are somewhat different than they would be if calculated directly from the other financial statements because of asset revaluations. Case 1: Riverview Community Hospital (A) 2011 2012 2013 EXHIBIT 1.4 River Community Hospital: Revenue and Expense Allocation (millions of dollars) $26.117 Operating Revenue Gross inpatient service Gross outpatient service Gross patient service revenue $33.216 $29.148 9.130 6.535 11.912 $45.128 $32.652 $38.278 Contractual allowances Bad debt and charity care Total revenue deductions $ 1.729 2.127 $ 3.856 $ 5.196 2.506 $7.702 $ 7.516 3.030 $10.546 Net patient service revenue $28.796 $30.576 $34.582 $22.229 Operating Expenses Inpatient service Outpatient service Total operating expenses $20.573 6.831 8.098 $30.327 $24.771 9.187 $33.958 $27.404 2011 2012 2013 EXHIBIT 1.5 River Community Hospital: Selected Operating Data Medicare discharges Total discharges Outpatient visits Licensed beds Staffed beds Patient days All-payer case mix index Full-time equivalents 2,721 8,784 32,285 210 193 44,085 1.2869 610.8 2,860 8,318 32,878 210 197 2,741 8,576 36,796 210 178 40,062 42,434 1.2993 625.8 1.3161 619.3 10 Cases in Healthcare Finance +Quartile Median -Quartile EXHIBIT 1.6 2013 Selected Industry Financial Ratios (200-299 beds) Profitability Ratios Total margin Return on assets Return on equity Deductible ratio 5.58% 5.80% 15.66% 0.34 3.48% 3.10% 6.01% 0.26 0.53% 0.40% 0.62% 0.18 Liquidity Ratios Current ratio Days cash on hand 2.53 32.35 1.99 15.89 1.48 6.24 Debt Management Ratios Debt ratio Debt to equity ratio Times interest earned Cash flow coverage 62.90% 127.00% 4.29 5.32 48.40% 64.70% 2.23 3.22 35.20% 26.90% 1.14 1.76 1.76 2.20 1.04 1.49 0.75 0.89 Asset Management Ratios Fixed asset turnover Total asset turnover Days in patient accounts receivable Current asset turnoverb Average payment period (days) 87.53 3.94 71.24 75.67 3.38 56.52 63.33 2.88 45.84 Other Ratios Average age of plant (years) 8.86 7.39 6.14 Deductions/Gross patient service revenue 10 Cases in Healthcare Finance +Quartile Median -Quartile EXHIBIT 1.6 2013 Selected Industry Financial Ratios (200-299 beds) Profitability Ratios Total margin Return on assets Return on equity Deductible ratio 5.58% 5.80% 15.66% 0.34 3.48% 3.10% 6.01% 0.26 0.53% 0.40% 0.62% 0.18 Liquidity Ratios Current ratio Days cash on hand 2.53 32.35 1.99 15.89 1.48 6.24 Debt Management Ratios Debt ratio Debt to equity ratio Times interest earned Cash flow coverage 62.90% 127.00% 4.29 5.32 48.40% 64.70% 2.23 3.22 35.20% 26.90% 1.14 1.76 1.76 2.20 1.04 1.49 0.75 0.89 Asset Management Ratios Fixed asset turnover Total asset turnover Days in patient accounts receivable Current asset turnoverb Average payment period (days) 87.53 3.94 71.24 75.67 3.38 56.52 63.33 2.88 45.84 Other Ratios Average age of plant (years) 8.86 7.39 6.14 Deductions/Gross patient service revenue
Step by Step Solution
There are 3 Steps involved in it

Get step-by-step solutions from verified subject matter experts