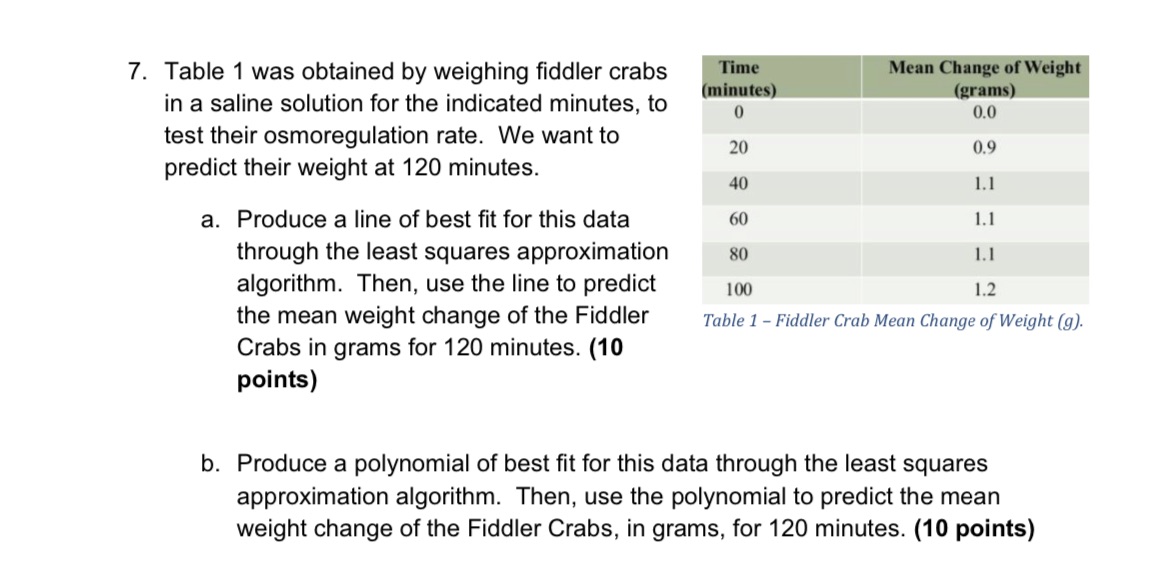
Question: 7. Table 1 was obtained by weighing fiddler crabs _ in a saline solution for the indicated minutes, to o no test their osmoregulation rate.

7. Table 1 was obtained by weighing fiddler crabs
7. Table 1 was obtained by weighing fiddler crabs _ in a saline solution for the indicated minutes, to o no test their osmoregulation rate. We want to 20 03 predict their weight at 120 minutes. 40 u a. Produce a line of best fit for this data 60 Ll through the least squares approximation so l.l algorithm. Then, use the line to predict loo .2 the mean WBith Change Of the Fiddler Table 1 - Fiddler Crab Mean Change of Weight (9). Grabs in grams for 120 minutes. (10 points) b. Produce a polynomial of best t for this data through the least squares approximation algorithm. Then, use the polynomial to predict the mean weight change of the Fiddler Crabs, in grams, for 120 minutes. (10 points)

Step by Step Solution

There are 3 Steps involved in it

1 Expert Approved Answer
Step: 1 Unlock blur-text-image
Question Has Been Solved by an Expert!

Get step-by-step solutions from verified subject matter experts

Step: 2 Unlock
Step: 3 Unlock

Students Have Also Explored These Related Mathematics Questions!