

Question: 7. Technology: For the following data sets find the equation of the regression line and construct a scatter plot of the data and draw a
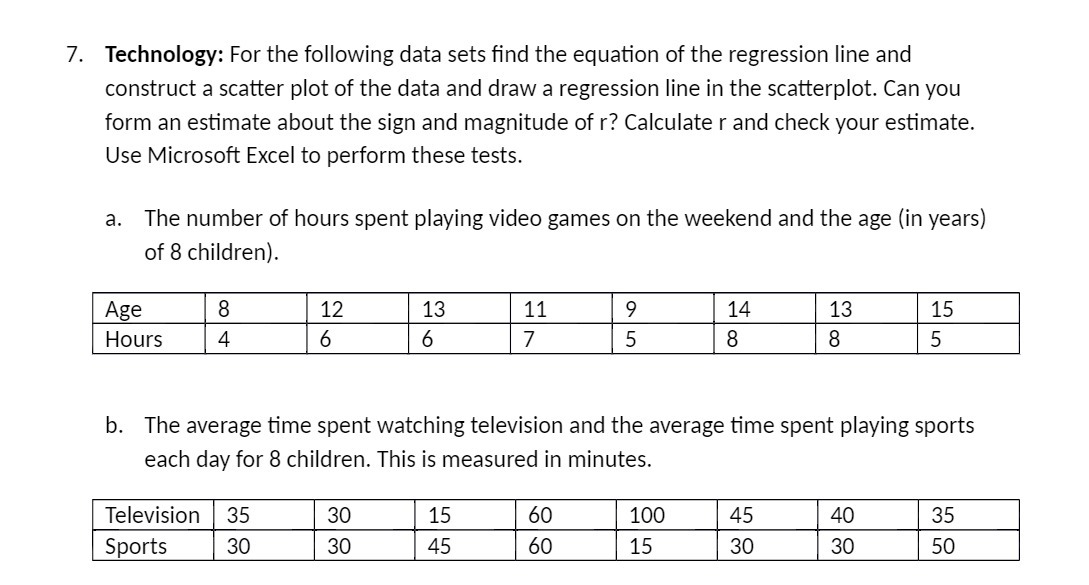
7. Technology: For the following data sets find the equation of the regression line and construct a scatter plot of the data and draw a regression line in the scatterplot. Can you form an estimate about the sign and magnitude of r? Calculate r and check your estimate. Use Microsoft Excel to perform these tests. a. The number of hours spent playing video games on the weekend and the age (in years) of 8 children). Age 8 12 13 11 Hours 9 4 14 6 13 6 7 15 5 8 8 5 b. The average time spent watching television and the average time spent playing sports each day for 8 children. This is measured in minutes. Television 35 30 15 60 Sports 100 30 45 30 40 45 35 60 15 30 30 50
Step by Step Solution
There are 3 Steps involved in it

Get step-by-step solutions from verified subject matter experts