

Question: 7. The Excel file Portfolio Bond Immunization Data contains information about three bonds. Coupons are paid annually. Use this data to: a. Compute the amount
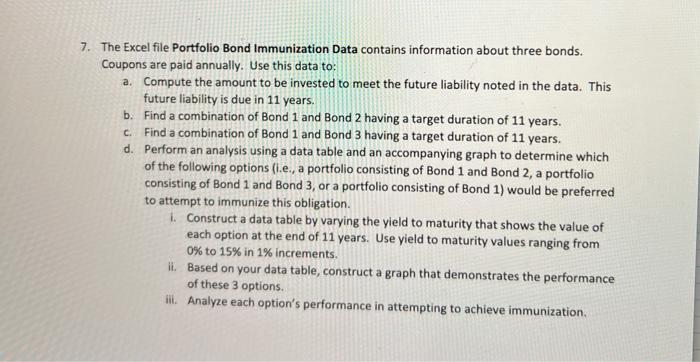
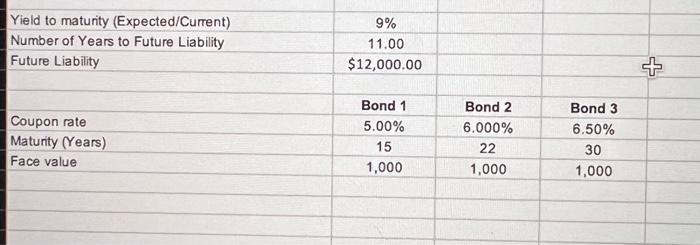
7. The Excel file Portfolio Bond Immunization Data contains information about three bonds. Coupons are paid annually. Use this data to: a. Compute the amount to be invested to meet the future liability noted in the data. This future liability is due in 11 years. b. Find a combination of Bond 1 and Bond 2 having a target duration of 11 years. cFind a combination of Bond 1 and Bond 3 having a target duration of 11 years. d. Perform an analysis using a data table and an accompanying graph to determine which of the following options (i.e., a portfolio consisting of Bond 1 and Bond 2, a portfolio consisting of Bond 1 and Bond 3, or a portfolio consisting of Bond 1) would be preferred to attempt to immunize this obligation. 1. Construct a data table by varying the yield to maturity that shows the value of each option at the end of 11 years. Use yield to maturity values ranging from 0% to 15% in 1% increments. it. Based on your data table, construct a graph that demonstrates the performance of these 3 options ill. Analyze each option's performance in attempting to achieve immunization Yield to maturity (Expected/Current) Number of years to Future Liability Future Liability 9% 11.00 $12,000.00 + Coupon rate Maturity (Years) Face value Bond 1 5.00% 15 1,000 Bond 2 6.000% 22 1,000 Bond 3 6.50% 30 1,000 7. The Excel file Portfolio Bond Immunization Data contains information about three bonds. Coupons are paid annually. Use this data to: a. Compute the amount to be invested to meet the future liability noted in the data. This future liability is due in 11 years. b. Find a combination of Bond 1 and Bond 2 having a target duration of 11 years. cFind a combination of Bond 1 and Bond 3 having a target duration of 11 years. d. Perform an analysis using a data table and an accompanying graph to determine which of the following options (i.e., a portfolio consisting of Bond 1 and Bond 2, a portfolio consisting of Bond 1 and Bond 3, or a portfolio consisting of Bond 1) would be preferred to attempt to immunize this obligation. 1. Construct a data table by varying the yield to maturity that shows the value of each option at the end of 11 years. Use yield to maturity values ranging from 0% to 15% in 1% increments. it. Based on your data table, construct a graph that demonstrates the performance of these 3 options ill. Analyze each option's performance in attempting to achieve immunization Yield to maturity (Expected/Current) Number of years to Future Liability Future Liability 9% 11.00 $12,000.00 + Coupon rate Maturity (Years) Face value Bond 1 5.00% 15 1,000 Bond 2 6.000% 22 1,000 Bond 3 6.50% 30 1,000
Step by Step Solution
There are 3 Steps involved in it

Get step-by-step solutions from verified subject matter experts