

Question: 7 The mean and standard deviations for a process are p = 80 and o = 10. For the variable control chart, a sample size
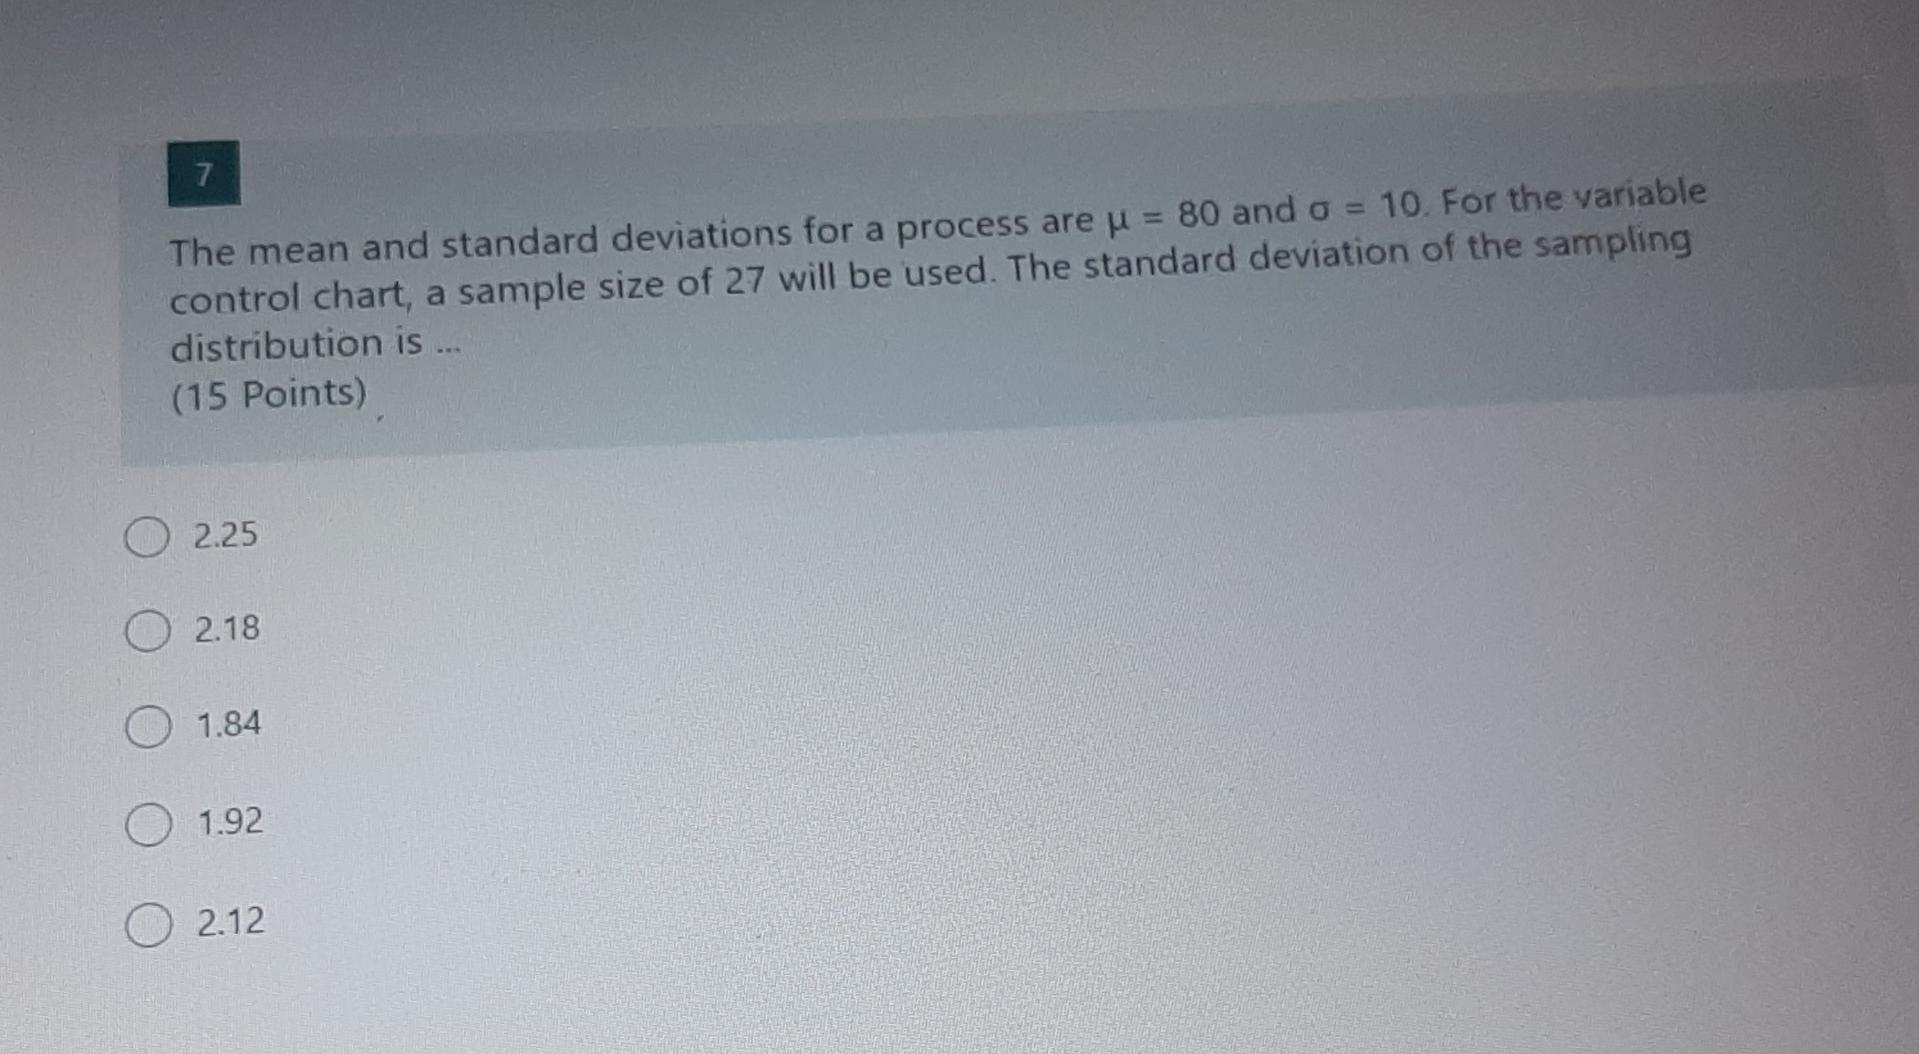
7 The mean and standard deviations for a process are p = 80 and o = 10. For the variable control chart, a sample size of 27 will be used. The standard deviation of the sampling distribution is ... (15 Points) O 2.25 02.18 O 1.84 O 1.92 O 2.12
Step by Step Solution
There are 3 Steps involved in it
1 Expert Approved Answer
Step: 1 Unlock

Question Has Been Solved by an Expert!
Get step-by-step solutions from verified subject matter experts
Step: 2 Unlock
Step: 3 Unlock