

Question: 7. The scatterplot below shows the relationship between the average monthly temperature and the monthly cost of a gas bill. The correlation coefficient between the
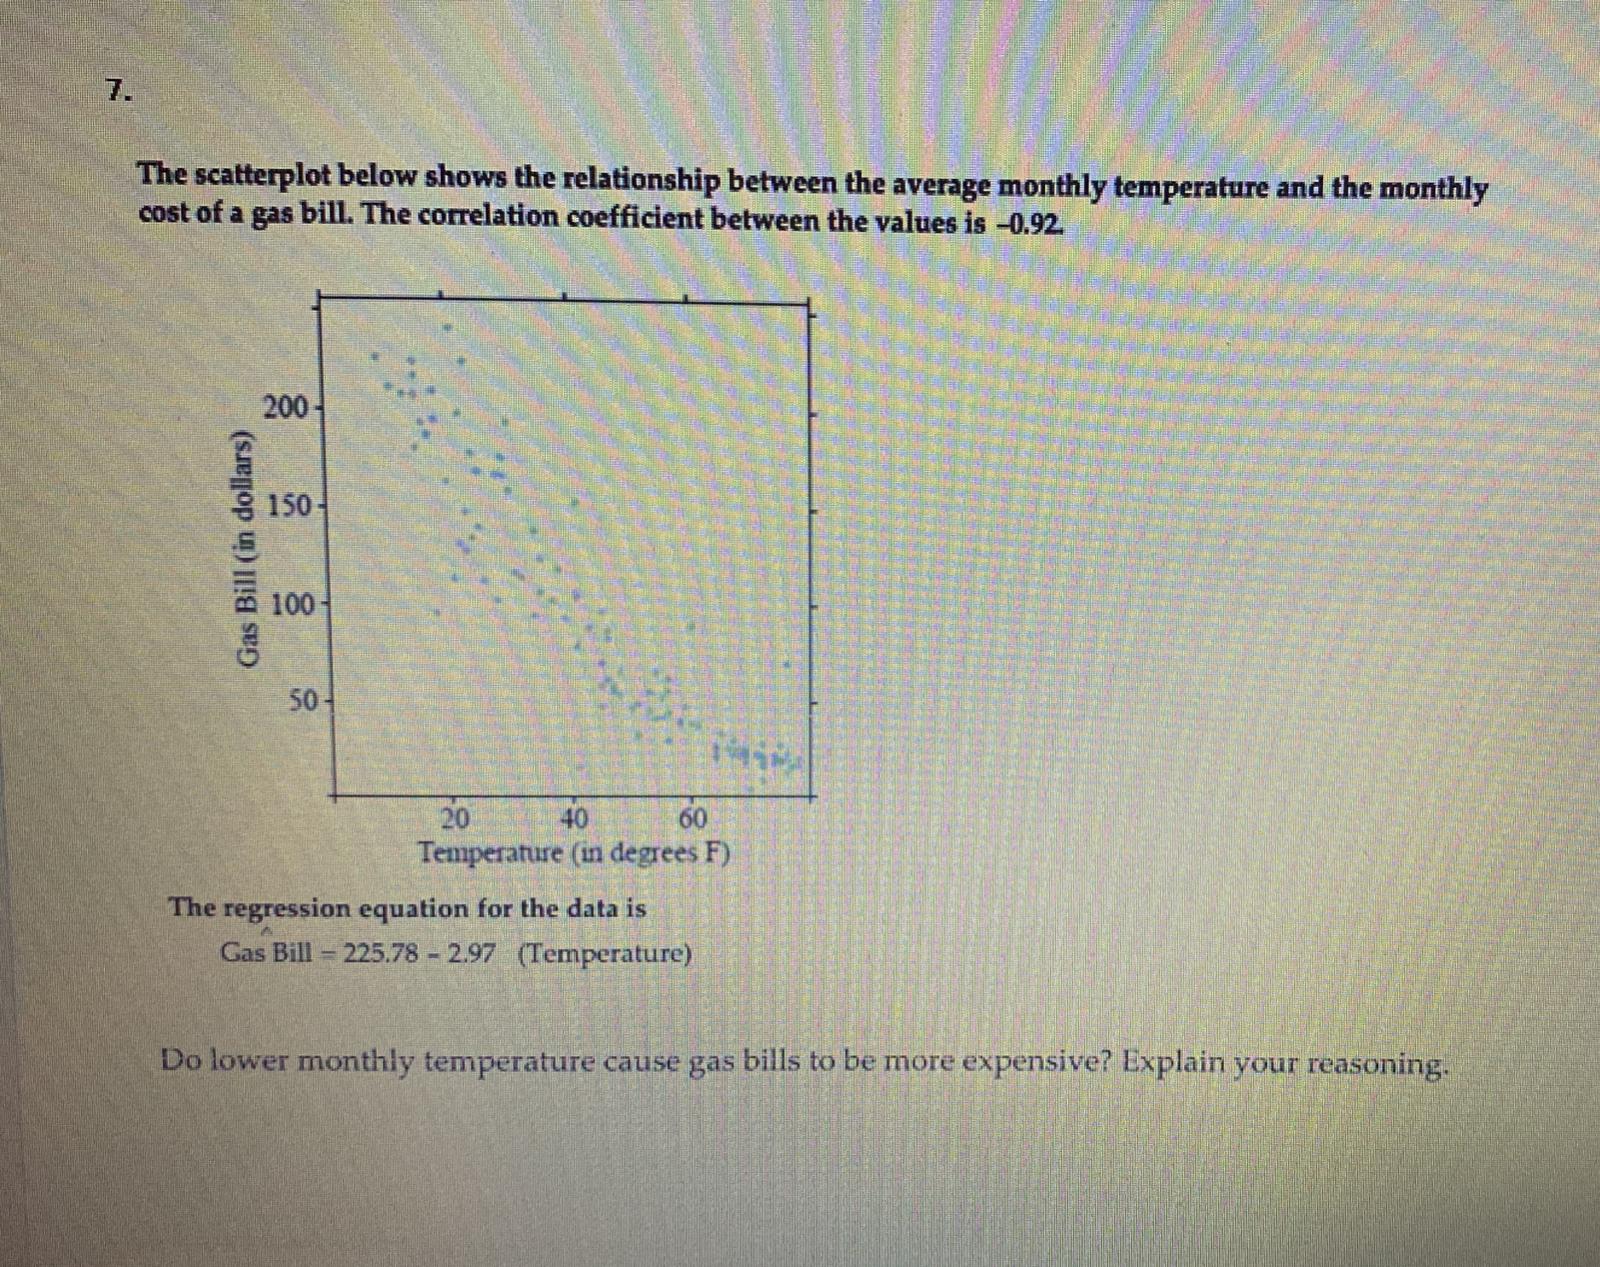
7. The scatterplot below shows the relationship between the average monthly temperature and the monthly cost of a gas bill. The correlation coefficient between the values is -0.92. 200 150 Gas Bill (in dollars) 100 50 20 40 60 Temperature (in degrees F) The regression equation for the data is Gas Bill - 225.78 - 2.97 (Temperature) Do lower monthly temperature cause gas bills to be more expensive? Explain your reasoning
Step by Step Solution
There are 3 Steps involved in it
1 Expert Approved Answer
Step: 1 Unlock

Question Has Been Solved by an Expert!
Get step-by-step solutions from verified subject matter experts
Step: 2 Unlock
Step: 3 Unlock