

Question: 7. The security market line is a linear function which is graphed by plotting data points based on the relationship between which two of the
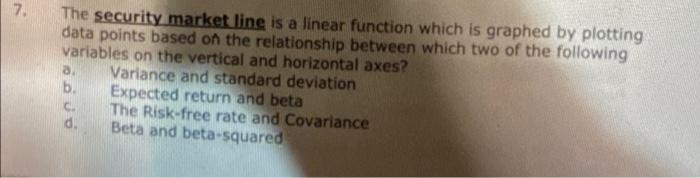
7. The security market line is a linear function which is graphed by plotting data points based on the relationship between which two of the following variables on the vertical and horizontal axes? a. Variance and standard deviation b. Expected return and beta C The Risk-free rate and covariance d. Beta and beta-squared
Step by Step Solution
There are 3 Steps involved in it
1 Expert Approved Answer
Step: 1 Unlock

Question Has Been Solved by an Expert!
Get step-by-step solutions from verified subject matter experts
Step: 2 Unlock
Step: 3 Unlock