

Question: 7. Using tables to calculate probabilities from the normal distribution Use the following unit normal tables and accompanying figures to determine the probability that a
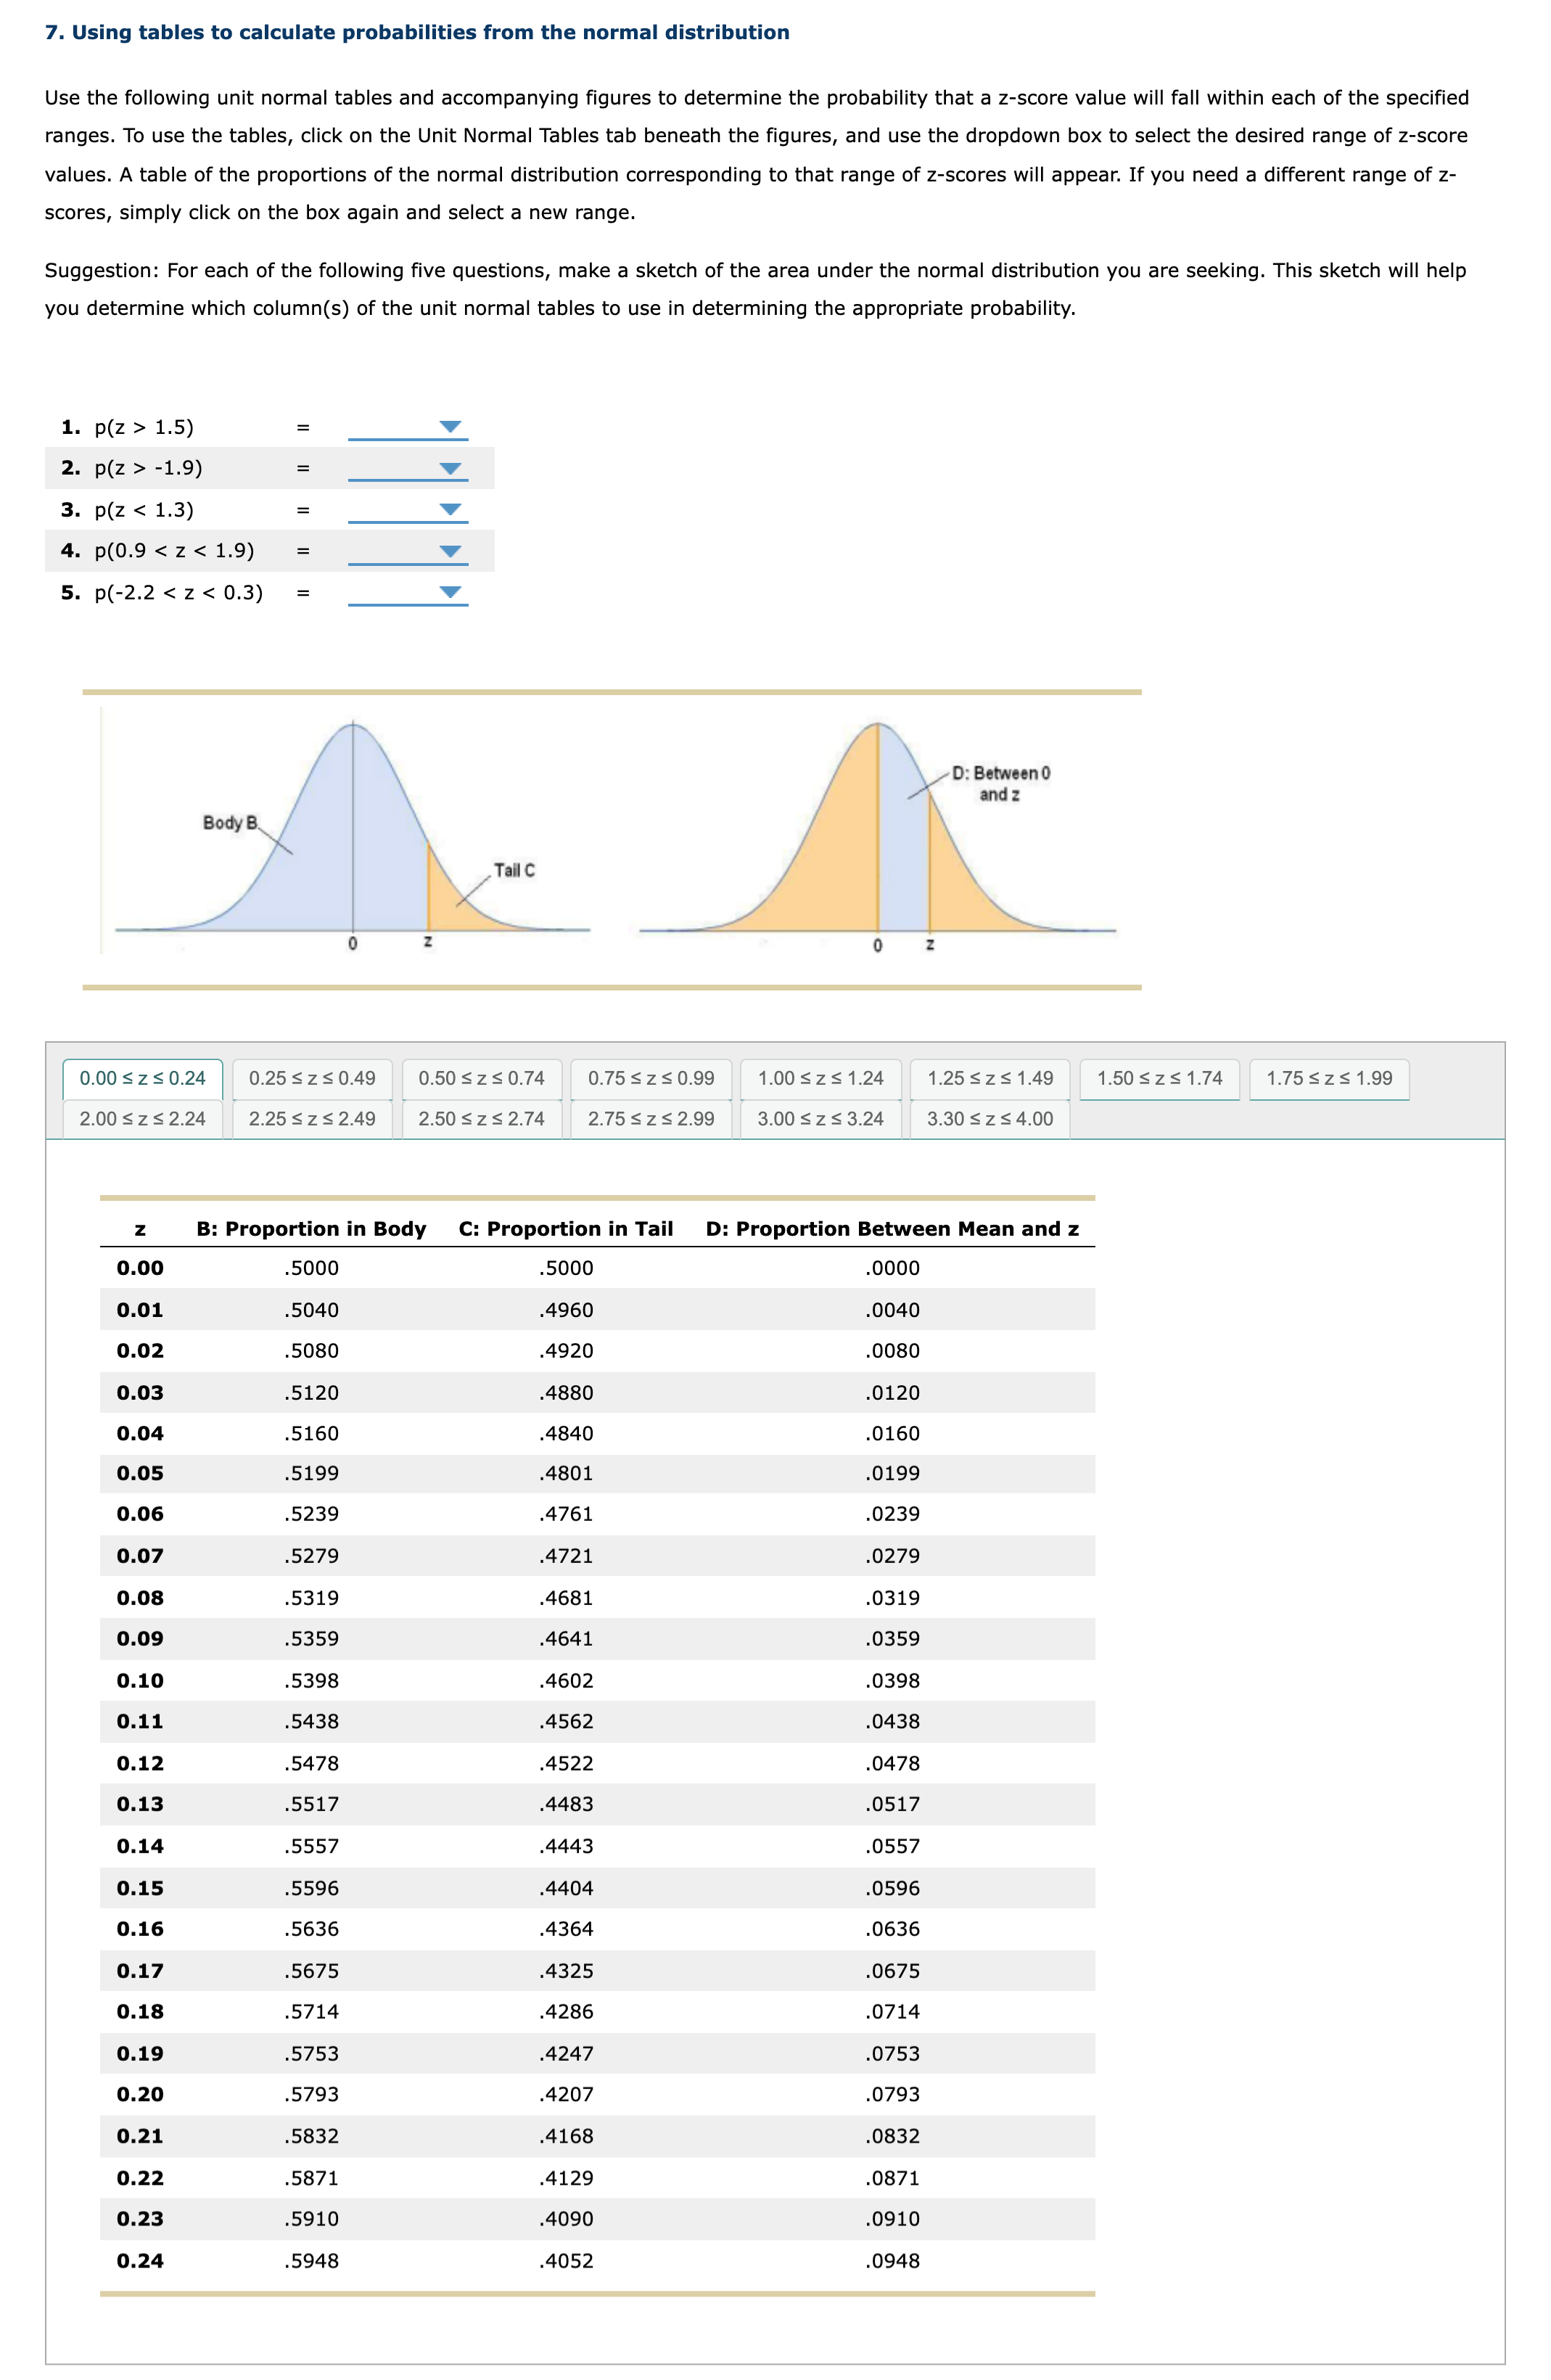
7. Using tables to calculate probabilities from the normal distribution Use the following unit normal tables and accompanying figures to determine the probability that a z-score value will fall within each of the specified ranges. To use the tables, click on the Unit Normal Tables tab beneath the figures, and use the dropdown box to select the desired range of z-score values. A table of the proportions of the normal distribution corresponding to that range of z-scores will appear. If you need a different range of z- scores, simply click on the box again and select a new range. Suggestion: For each of the following five questions, make a sketch of the area under the normal distribution you are seeking. This sketch will help you determine which column(s) of the unit normal tables to use in determining the appropriate probability. 1. p(z > 1.5) 2. p(z > - 1.9) 3. p(z
Step by Step Solution
There are 3 Steps involved in it

Get step-by-step solutions from verified subject matter experts