

Question: 7 . Using the method indicated in the previous question (per the MAD metric) to forecast Winter Wheels attendance for 2023. Select the closest match
7 . Using the method indicated in the previous question (per the MAD metric) to forecast Winter Wheels attendance for 2023. Select the closest match below. Look at Part 3 for more info. Please provide answer and explanation.
| 335 | ||
| 612 | ||
| 369 | ||
| 603 |
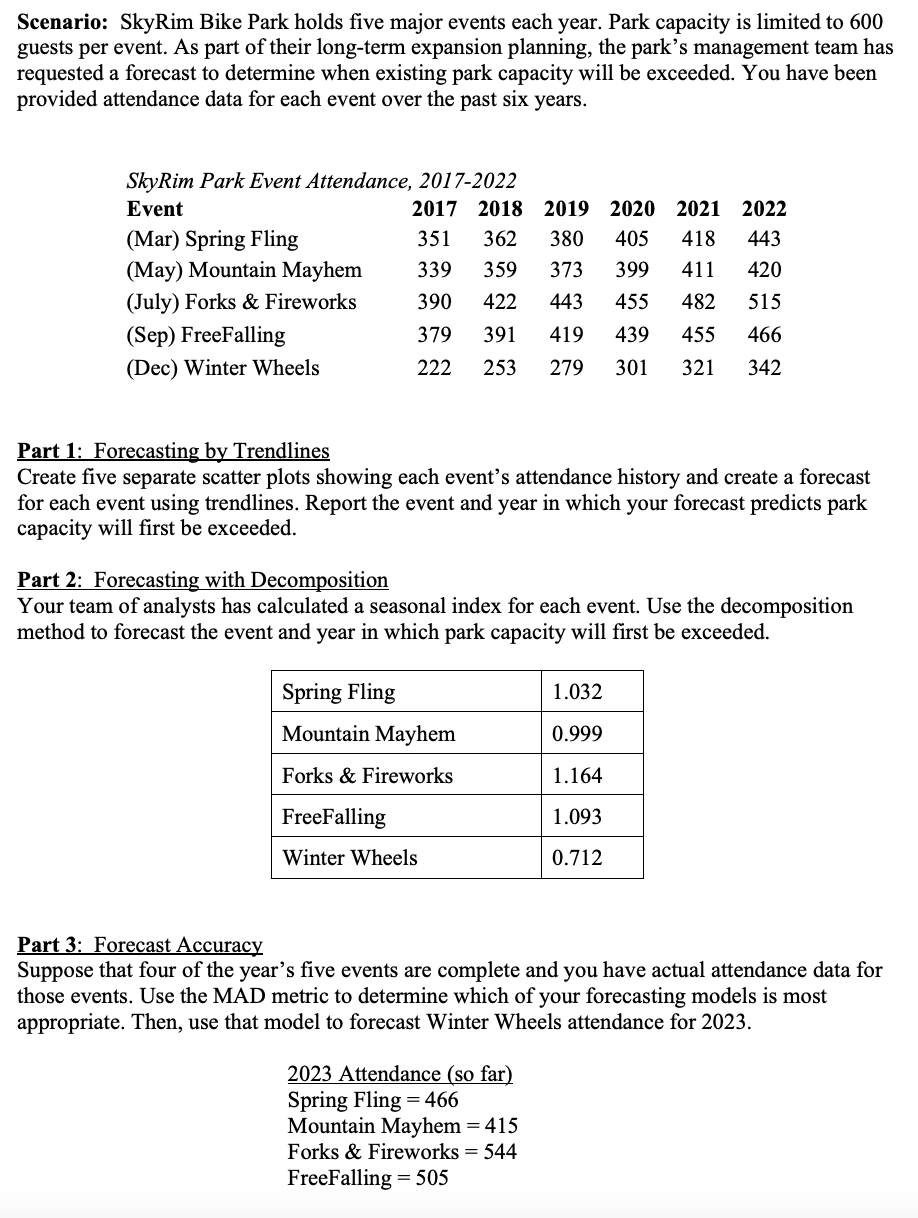
Scenario: SkyRim Bike Park holds five major events each year. Park capacity is limited to 600 guests per event. As part of their long-term expansion planning, the park's management team has requested a forecast to determine when existing park capacity will be exceeded. You have been provided attendance data for each event over the past six years. Part 1: Forecasting by Trendlines Create five separate scatter plots showing each event's attendance history and create a forecast for each event using trendlines. Report the event and year in which your forecast predicts park capacity will first be exceeded. Part 2: Forecasting with Decomposition Your team of analysts has calculated a seasonal index for each event. Use the decomposition method to forecast the event and year in which park capacity will first be exceeded. Part 3: Forecast Accuracy Suppose that four of the year's five events are complete and you have actual attendance data for those events. Use the MAD metric to determine which of your forecasting models is most appropriate. Then, use that model to forecast Winter Wheels attendance for 2023. 2023 Attendance (so far) Spring Fling =466 Mountain Mayhem =415 Forks \& Fireworks =544 FreeFalling =505
Step by Step Solution
There are 3 Steps involved in it

Get step-by-step solutions from verified subject matter experts