

Question: 7. We talked in class about selection bias in the context of hypothesis tests, but it affects many other aspects as well. For example, the
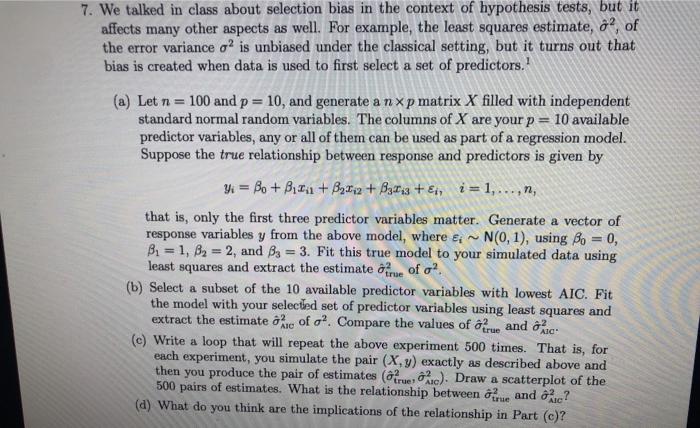
7. We talked in class about selection bias in the context of hypothesis tests, but it affects many other aspects as well. For example, the least squares estimate, ?, of the error variance ois unbiased under the classical setting, but it turns out that bias is created when data is used to first select a set of predictors.' (a) Let n = 100 and p=10, and generate a nxp matrix X filled with independent standard normal random variables. The columns of X are your p = 10 available predictor variables, any or all of them can be used as part of a regression model. Suppose the true relationship between response and predictors is given by yi = Bo + Bixa + B2.12 + B31:3 +Ei, i = 1,...,n, that is, only the first three predictor variables matter. Generate a vector of response variables y from the above model, where e; ~ N(0,1), using Bo = 0, Bi = 1, B2 = 2, and Bs = 3. Fit this true model to your simulated data using least squares and extract the estimate ofrue of o?. (b) Select a subset of the 10 available predictor variables with lowest AIC. Fit the model with your selected set of predictor variables using least squares and extract the estimate one of o?. Compare the values of a true and c. (c) Write a loop that will repeat the above experiment 500 times. That is, for each experiment, you simulate the pair (x,y) exactly as described above and then you produce the pair of estimates (o true, uc). Draw a scatterplot of the 500 pairs of estimates. What is the relationship between ofrue and c? (d) What do you think are the implications of the relationship in Part (c)? 7. We talked in class about selection bias in the context of hypothesis tests, but it affects many other aspects as well. For example, the least squares estimate, ?, of the error variance ois unbiased under the classical setting, but it turns out that bias is created when data is used to first select a set of predictors.' (a) Let n = 100 and p=10, and generate a nxp matrix X filled with independent standard normal random variables. The columns of X are your p = 10 available predictor variables, any or all of them can be used as part of a regression model. Suppose the true relationship between response and predictors is given by yi = Bo + Bixa + B2.12 + B31:3 +Ei, i = 1,...,n, that is, only the first three predictor variables matter. Generate a vector of response variables y from the above model, where e; ~ N(0,1), using Bo = 0, Bi = 1, B2 = 2, and Bs = 3. Fit this true model to your simulated data using least squares and extract the estimate ofrue of o?. (b) Select a subset of the 10 available predictor variables with lowest AIC. Fit the model with your selected set of predictor variables using least squares and extract the estimate one of o?. Compare the values of a true and c. (c) Write a loop that will repeat the above experiment 500 times. That is, for each experiment, you simulate the pair (x,y) exactly as described above and then you produce the pair of estimates (o true, uc). Draw a scatterplot of the 500 pairs of estimates. What is the relationship between ofrue and c? (d) What do you think are the implications of the relationship in Part (c)
Step by Step Solution
There are 3 Steps involved in it

Get step-by-step solutions from verified subject matter experts