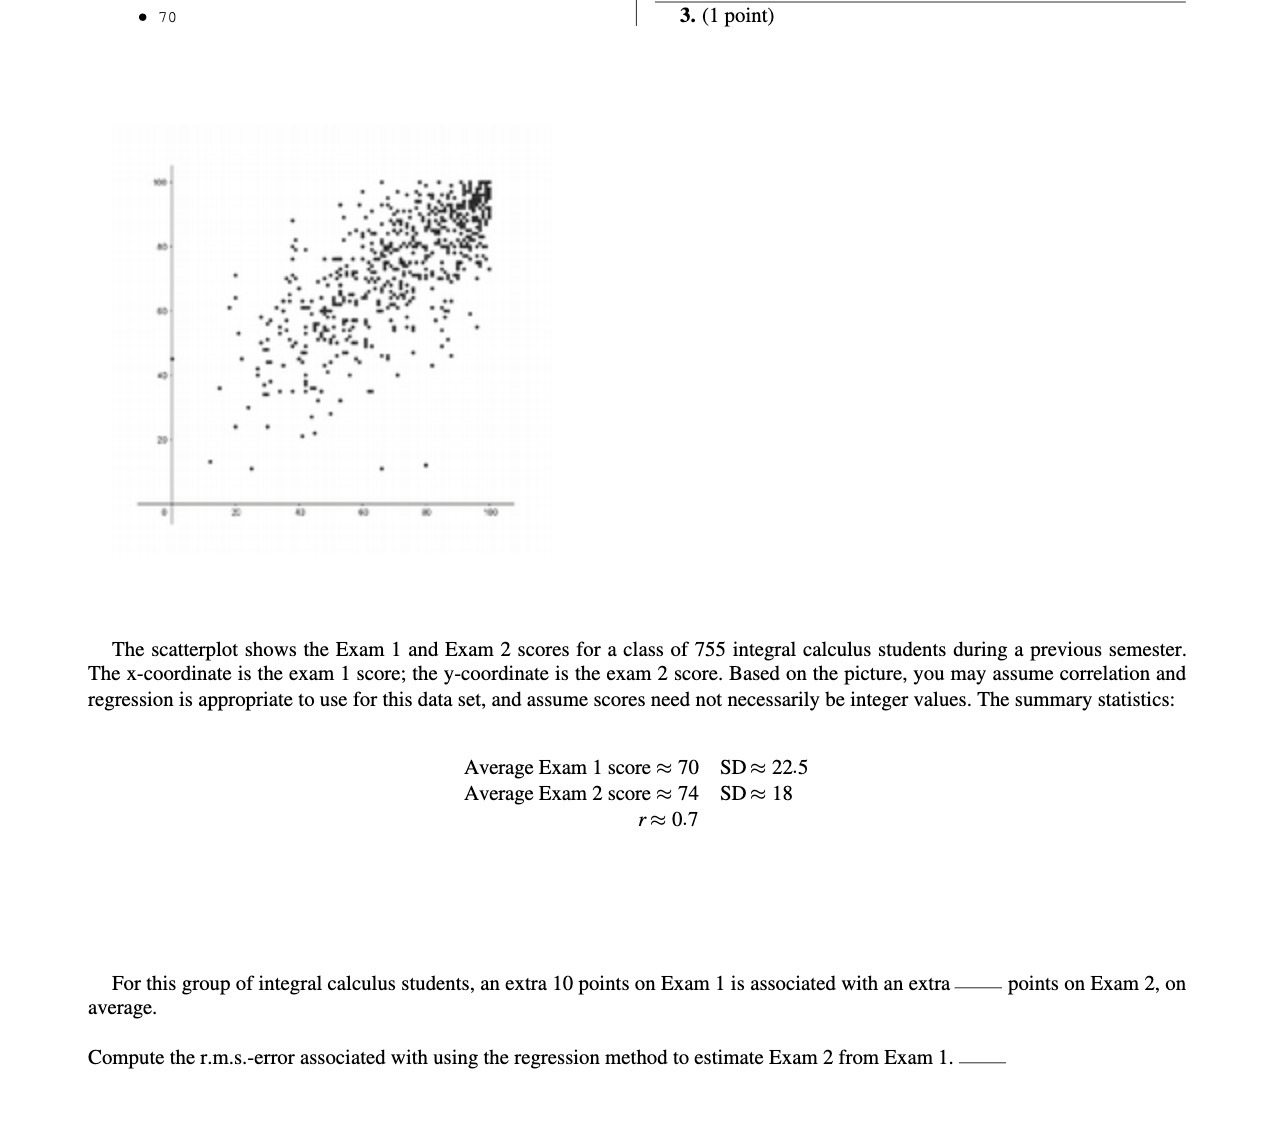
Question: . 70 3. (1 point) The scatterplot shows the Exam 1 and Exam 2 scores for a class of 755 integral calculus students during

. 70 \\ 3. (1 point) The scatterplot shows the
. 70 \\ 3. (1 point) The scatterplot shows the Exam 1 and Exam 2 scores for a class of 755 integral calculus students during a previous semester. The xcoordinate is the exam 1 score; the y-coordinate is the exam 2 score. Based on the picture, you may assume correlation and regression is appropriate to use for this data set, and assume scores need not necessarily be integer values. The summary statistics: Average Exam 1 score m 70 SD m 22.5 Average Exam 2 score m 74 SD m 18 r m 0.7 For this group of integral calculus students, an extra 10 points on Exam 1 is associated with an extra average. points on Exam 2, on Compute the r.m.s.error associated with using the regression method to estimate Exam 2 from Exam 1. _

Step by Step Solution

There are 3 Steps involved in it

1 Expert Approved Answer
Step: 1 Unlock blur-text-image
Question Has Been Solved by an Expert!

Get step-by-step solutions from verified subject matter experts

Step: 2 Unlock
Step: 3 Unlock

Students Have Also Explored These Related Mathematics Questions!