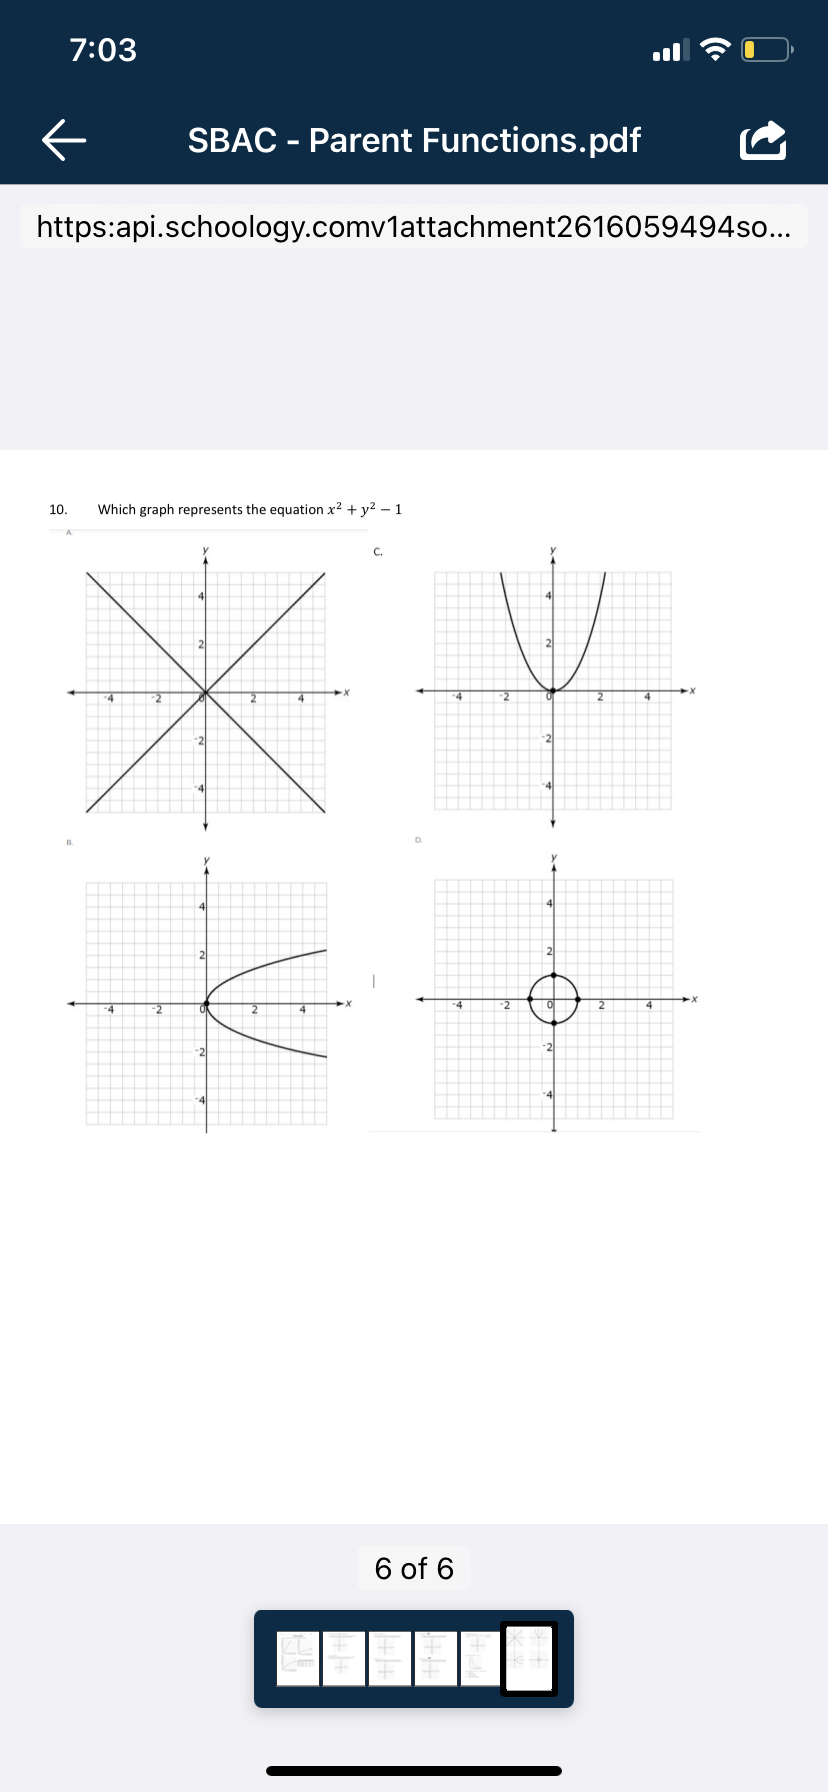
Question: 7:03 O K SBAC - Parent Functions.pdf https:api.schoology.comv1attachment2616059494so... 10. Which graph represents the equation x2 + y2 - 1 6 of 67:03 O K SBAC

7:03 O K SBAC - Parent Functions.pdf7:03 O K SBAC - Parent Functions.pdf7:03 O K SBAC - Parent Functions.pdf7:03 O K SBAC - Parent Functions.pdf7:03 O K SBAC - Parent Functions.pdf7:03 O K SBAC - Parent Functions.pdf
7:03 O K SBAC - Parent Functions.pdf https:api.schoology.comv1attachment2616059494so... 10. Which graph represents the equation x2 + y2 - 1 6 of 67:03 O K SBAC - Parent Functions.pdf https:api.schoology.comv1attachment2616059494so... 2. Given a linear function with a slope of = and a y-intercept of 2: Using the Add Arrow tool, draw a line on the coordinate grid to graph the function. Place a point on the line representing the x-intercept of the function. -8-6-4-20 -X 2 4 6 8 0 0 A NO 3. Given the function y = = x + 2, Using the Add Arrow tool, draw a line on the coordinate grid to graph the function. Place a point on the line representing the x-intercept of the function. NATO -X -8-6-4-20 2 4 6 8 2 of 67:03 O K SBAC - Parent Functions.pdf https:api.schoology.comv1attachment2616059494so... 4. Given the function y = = 12x - 1| + 2 . Using the Add Arrow tool, draw a line on the coordinate grid to graph the function. Place a point on the coordinate grid to show the y-intercept of the function. 8- 6- NA -X -8-6-4-2 2 4 68 Of No -8. 5. Given the function y = -x2 + x + 6, Place a point on the coordinate grid to show each x-intercept of the function. . Place a point on the coordinate grid to show the maximum value of the function. 8- 6. NA X -8-6-4-2. 2 46 8 0 0 A NO 3 of 67:03 O K SBAC - Parent Functions.pdf https:api.schoology.comv1attachment2616059494so... 6. Given the function y = vx +4 -1, Place a point on the coordinate grid to show each x-intercept of the function . Place a point on the coordinate grid to show the y-intercept of the function. NAO - X -8-6-4-20 2 4 68 0 0 A NO 7. Given the function y = Vx - 1 + 2, . Place a point on the coordinate grid to show the x-intercept of the function. . Place a point on the coordinate grid to show the y-intercept of the function. A X -8-6-4-20 2 4 6 8 0 0 A NO 4 of 67:03 O K SBAC - Parent Functions.pdf https:api.schoology.comv1attachment2616059494so... 8. Given the function y = 8log (x + 4), Place a point on the coordinate grid to show the x-intercept of the function. Place a point on the coordinate grid to show the y-intercept of the function. NAO X -8-6-4-25 2 4 6 8 9. This graph represents the equation y = 0.5(x-5). 1 2 3 4 5 6 7 8 9 How many ordered pairs (x, y) for 1

Step by Step Solution

There are 3 Steps involved in it

1 Expert Approved Answer
Step: 1 Unlock blur-text-image
Question Has Been Solved by an Expert!

Get step-by-step solutions from verified subject matter experts

Step: 2 Unlock
Step: 3 Unlock

Students Have Also Explored These Related Mathematics Questions!