

Question: 7.13.2 Simulating Multivariate t-Distributions The following code generates and plots four bivariate samples. Each sam- ple has univariate marginals that are standard t3-distributions. However, the
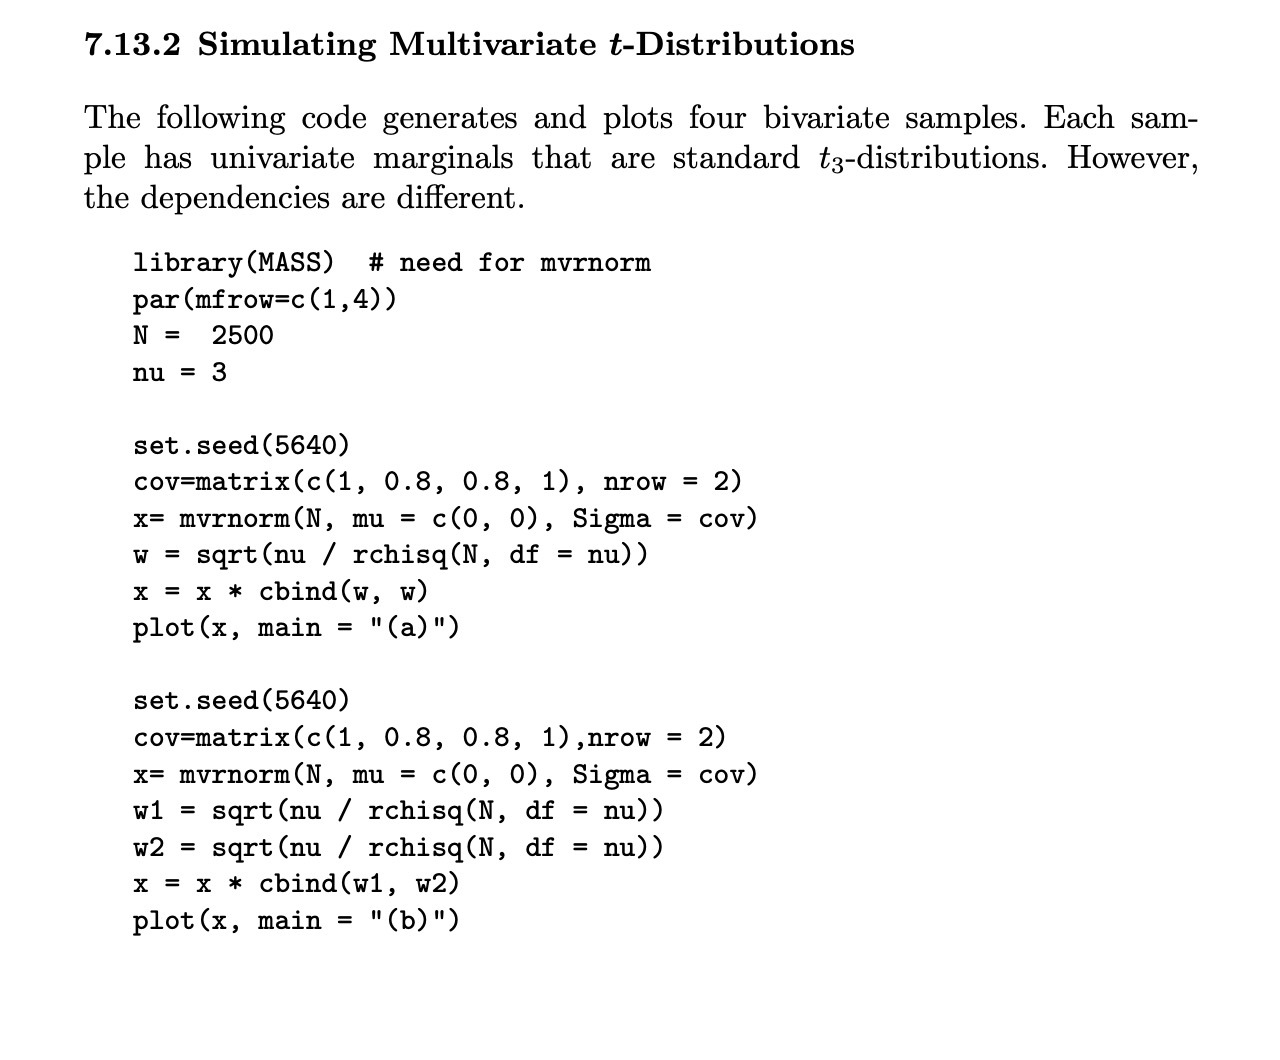

7.13.2 Simulating Multivariate t-Distributions The following code generates and plots four bivariate samples. Each sam- ple has univariate marginals that are standard t3-distributions. However, the dependencies are different. library (MASS) # need for mvrnorm par (mfrow=c (1, 4) ) N = 2500 nu = 3 set . seed (5640) cov=matrix (c(1, 0.8, 0.8, 1), nrow = 2) x= mvrnorm (N, mu = c(0, 0), Sigma = cov) w = sqrt (nu / rchisq(N, df = nu) ) x = x * cbind(w, w) plot (x, main = "(a)") set . seed (5640) cov=matrix (c (1, 0.8, 0.8, 1), nrow = 2) X= mvrnorm (N, mu = c(0, 0) , Sigma = cov) w1 = sqrt (nu / rchisq(N, df = nu) ) w2 = sqrt (nu / rchisq(N, df = nu) ) x = x * cbind (w1, w2) plot (x, main = "(b)")
Step by Step Solution
There are 3 Steps involved in it

Get step-by-step solutions from verified subject matter experts