

Question: 7-14??? Consider the doti contained in the table below, which lists 30 monthly excess returns to two different actively managed stock portfolios (A and a)
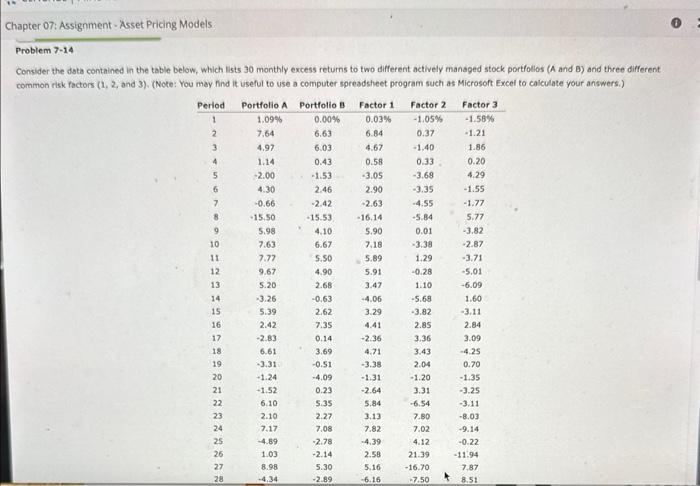
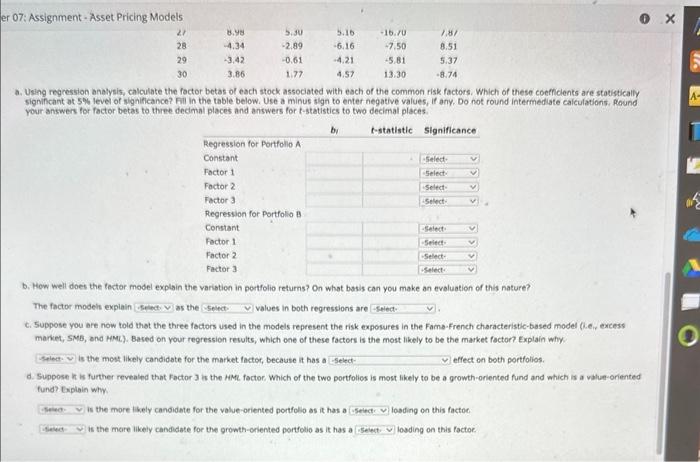
Consider the doti contained in the table below, which lists 30 monthly excess returns to two different actively managed stock portfolios (A and a) and three different. common risk factors (1, 2, and 3). (Note: You may find ik useful to use a computer spreadsheet program such as Microsoft Excel to calculate your answers.) a. Using regression analysis, calculate the foctor betas of each stock associated with each of the common fisk factors. Which of these coefficients are statistically signifcant at 5\% level of significance? Ail in the table below. Use a minus sign to enter negative values, if any, Do not round intermediate calculations. Pound your answers for foctor betas to three decimal places and answers for t-statistics to two decimal places b. How well does the tector model explain the varistion in portfolio returns? On what basis can you make an evoluation of this nature? The factor modeit explain as the values in both regressions are c. Suppose you are now told that the three factors used in the models represent the risk exposures in the Famb-French characteristic-based model (i.e., exicess market, SMB, and MML.). Based on your regression rewults, which one of these factors is the most likely to be the market factor? Explain why. is the ment likely candidete for the market factor, because it has a effect en beth portfolios. d. Suppose in is further revealed that Factor 3 is the HML factor. Which of the two portfolios is most likely to be a growth-oriented fund and ahich is a value-oriented fund? Explain why is the more likely candidate for the value-oriented portfolio as it has a losding on this factoe. is the more likely candidate for the growth-oriented portfolio as it has a losding on this factoe Consider the doti contained in the table below, which lists 30 monthly excess returns to two different actively managed stock portfolios (A and a) and three different. common risk factors (1, 2, and 3). (Note: You may find ik useful to use a computer spreadsheet program such as Microsoft Excel to calculate your answers.) a. Using regression analysis, calculate the foctor betas of each stock associated with each of the common fisk factors. Which of these coefficients are statistically signifcant at 5\% level of significance? Ail in the table below. Use a minus sign to enter negative values, if any, Do not round intermediate calculations. Pound your answers for foctor betas to three decimal places and answers for t-statistics to two decimal places b. How well does the tector model explain the varistion in portfolio returns? On what basis can you make an evoluation of this nature? The factor modeit explain as the values in both regressions are c. Suppose you are now told that the three factors used in the models represent the risk exposures in the Famb-French characteristic-based model (i.e., exicess market, SMB, and MML.). Based on your regression rewults, which one of these factors is the most likely to be the market factor? Explain why. is the ment likely candidete for the market factor, because it has a effect en beth portfolios. d. Suppose in is further revealed that Factor 3 is the HML factor. Which of the two portfolios is most likely to be a growth-oriented fund and ahich is a value-oriented fund? Explain why is the more likely candidate for the value-oriented portfolio as it has a losding on this factoe. is the more likely candidate for the growth-oriented portfolio as it has a losding on this factoe
Step by Step Solution
There are 3 Steps involved in it

Get step-by-step solutions from verified subject matter experts