

Question: 7.19 Global warming, Part I. Let's consider a limited set of climate data, examining temperature dierences in 1948 vs 2018. We sampled 197 locations from
7.19 Global warming, Part I. Let's consider a limited set of climate data, examining temperature dierences
in 1948 vs 2018. We sampled 197 locations from the National Oceanic and Atmospheric Administration's
(NOAA) historical data, where the data was available for both years of interest. We want to know: were
there more days with temperatures exceeding 90F in 2018 or in 1948?12 The dierence in number of days
exceeding 90F (number of days in 2018 - number of days in 1948) was calculated for each of the 197 locations.
The average of these dierences was 2.9 days with a standard deviation of 17.2 days. We are interested in
determining whether these data provide strong evidence that there were more days in 2018 that exceeded
90F from NOAA's weather stations.
(a) Is there a relationship between the observations collected in 1948
and 2018? Or are the observations in the two groups independent?
Explain.
(b) Write hypotheses for this research in symbols and in words.
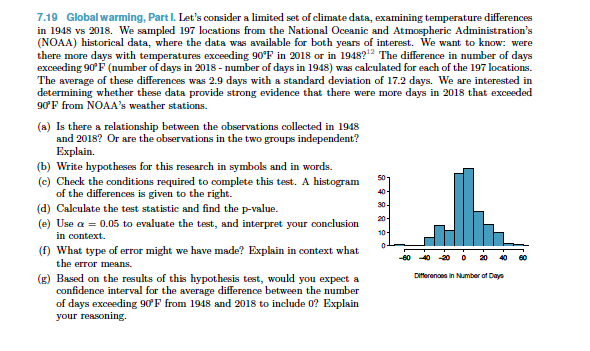
(c) Check the conditions required to compl this test. A histogram
of the dierences is given to the right.
(d) Calculate the test statistic and nd the p-value.
(e) Use = 0:05 to evaluate the test, and interpret your conclusion
in context.
(f) What type of error might we have made? Explain in context what
the error means.
(g) Based on the results of this hypothesis test, would you expect a
condence interval for the average dierence between the number
of days exceeding 90F from 1948 and 2018 to include 0? Explain
your reasoning.
7.19 Global warming, Part I. Let's consider a limited set of climate data, examining temperature differences in 1948 vs 2018. We sampled 197 locations from the National Oceanic and Atmospheric Administration's (NOAA) historical data, where the data was available for both years of interest. We want to know: were there more days with temperatures exceeding 90'F in 2018 or in 1948?" The difference in number of days exceeding 90'F (number of days in 2018 - number of days in 1948) was calculated for each of the 197 locations. The average of these differences was 2.9 days with a standard deviation of 17.2 days. We are interested in determining whether these data provide strong evidence that there were more days in 2018 that exceeded 90'F from NOAA's weather stations. (a) Is there a relationship between the observations collected in 1948 and 2018? Or are the observations in the two groups independent? Explain. (b) Write hypotheses for this research in symbols and in words. (c) Check the conditions required to complete this test. A histogram 50 7 of the differences is given to the right. 40 - (d) Calculate the test statistic and find the p-value. (e) Use a = 0.05 to evaluate the test, and interpret your conclusion 20 4 in context. 10 (f) What type of error might we have made? Explain in context what the error means. -40 -20 20 40 (g) Based on the results of this hypothesis test, would you expect a Differonona In Number of Days confidence interval for the average difference between the number of days exceeding 90'F from 1948 and 2018 to include 0? Explain your reasoning
Step by Step Solution
There are 3 Steps involved in it

Get step-by-step solutions from verified subject matter experts