

Question: 7.1.List the predictors and the response from the above Table 7. [4] 7.2.Describe how you will go about selecting the classifier for this data in
7.1.List the predictors and the response from the above Table 7. [4] 7.2.Describe how you will go about selecting the classifier for this data in MATLAB. [3] 7.3.Create a MATLAB m-file to load this data in MATLAB and calculate the mean and variance of the last three columns.
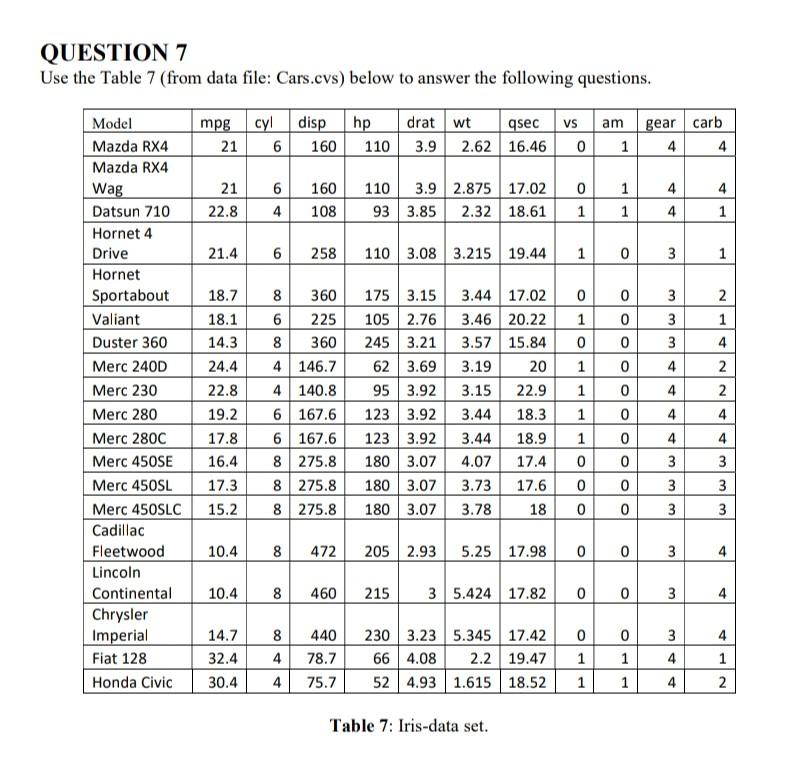
QUESTION 7 Use the Table 7 (from data file: Cars.cvs) below to answer the following questions. hp mpg cyl disp 21 6 160 drat wt qsec vs 3.9 2.62 16.46 0 am 1 gear carb 4 4 110 0 4 21 22.8 6 4 160 108 110 3.9 2.875 17.02 93 3.85 2.32 18.61 1 1 4 1 1 4 21.4 6 258 110 3.08 3.215 19.44 1 0 1 oo 0 225 1 000 olo | [ 3 4 2 1 4 2 2 Model Mazda RX4 Mazda RX4 Wag Datsun 710 Hornet 4 Drive Hornet Sportabout Valiant Duster 360 Merc 240D Merc 230 Merc 280 Merc 280C Merc 450SE Merc 450SL Merc 450SLC Cadillac Fleetwood Lincoln Continental Chrysler Imperial Fiat 128 Honda Civic 4 18.7 18.1 14.3 24.4 22.8 19.2 17.8 16.4 17.3 15.2 8 360 6 8 360 4 146.7 4 140.8 6 167.6 6 167.6 8 275.8 8 275.8 8 275.8 175 3.15 105 2.76 245 3.21 62 3.69 95 3.92 123 3.92 123 3.92 180 3.07 180 3.07 180 3.07 3.44 17.02 3.46 20.22 3.57 15.84 3.19 20 3.15 22.9 3.44 18.3 3.44 18.9 4.07 17.4 3.73 17.6 3.78 18 1 1 1 1 0 0 0 0 4 4 4 olo 0 | www 0 O 10.4 8 472 205 2.93 5.25 17.98 0 0 3 4 10.4 8 460 215 3 5.424 17.82 0 0 3 4 0 4 14.7 32.4 30.4 8 4 4 440 78.7 75.7 230 3.23 5.345 17.42 66 4.08 2.2 19.47 52 4.93 1.615 18.52 0 1 0 1 1 3 4 1 1 1 4 1 4 4 N Table 7: Iris-data set
Step by Step Solution
There are 3 Steps involved in it

Get step-by-step solutions from verified subject matter experts