

Question: 72 Section C: Forecasting Techniques (Total marks: 33 marks) Question 7 (15 marks) The following table describes the Sales figures of a company for Years
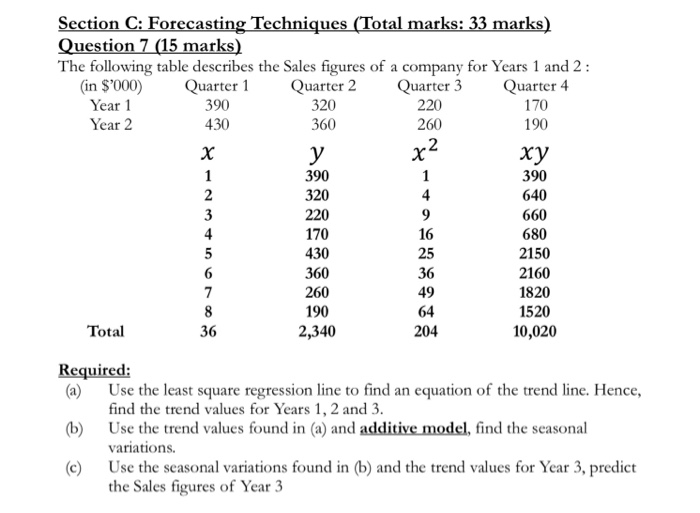
72 Section C: Forecasting Techniques (Total marks: 33 marks) Question 7 (15 marks) The following table describes the Sales figures of a company for Years 1 and 2: (in $'000) Quarter 1 Quarter 2 Quarter 3 Quarter 4 Year 1 390 320 220 170 Year 2 430 360 260 190 y 1 390 390 2 320 4 640 3 220 9 660 4 170 16 680 5 430 25 2150 6 360 36 2160 7 260 49 1820 8 190 64 1520 Total 36 2,340 204 10,020 1 Required: (a) Use the least square regression line to find an equation of the trend line. Hence, find the trend values for Years 1, 2 and 3. (b) Use the trend values found in (a) and additive model, find the seasonal variations. Use the seasonal variations found in (b) and the trend values for Year 3, predict the Sales figures of Year 3
Step by Step Solution
There are 3 Steps involved in it

Get step-by-step solutions from verified subject matter experts