

Question: 7.2 The chart to the right indicates projected demand for nurses. Part 2 of 3 Points: 0 of 1 Projected Demand for Nurses 2.8
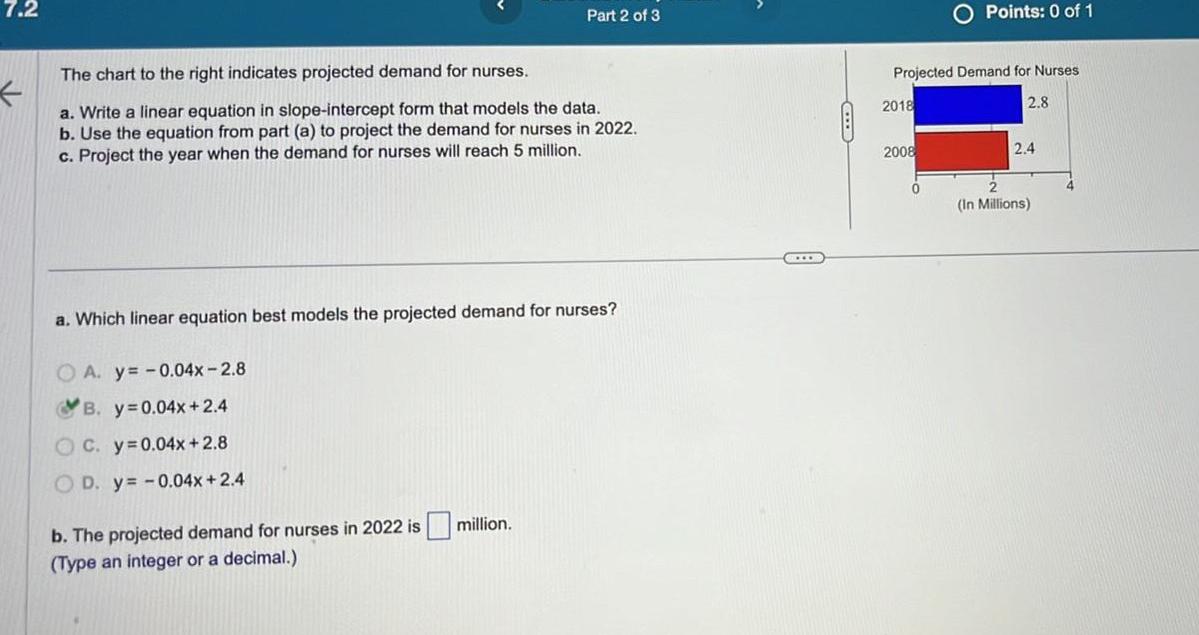
7.2 The chart to the right indicates projected demand for nurses. Part 2 of 3 Points: 0 of 1 Projected Demand for Nurses 2.8 a. Write a linear equation in slope-intercept form that models the data. b. Use the equation from part (a) to project the demand for nurses in 2022. c. Project the year when the demand for nurses will reach 5 million. 2018 2008 a. Which linear equation best models the projected demand for nurses? OA. y=-0.04x-2.8 B. y=0.04x+2.4 C. y 0.04x+2.8 OD. y=-0.04x+2.4 b. The projected demand for nurses in 2022 is (Type an integer or a decimal.) million. 2.4 (In Millions)
Step by Step Solution
There are 3 Steps involved in it

Get step-by-step solutions from verified subject matter experts