

Question: 7-2A Date Transaction Number per units Per Unit Total Jan. 1 Inventory 7500 75.00 562500 10 Purchase 22500 85.00 1912500 28 sale 11250 150.00 1687500
7-2A
| Date | Transaction | Number per units | Per Unit | Total |
| Jan. 1 | Inventory | 7500 | 75.00 | 562500 |
| 10 | Purchase | 22500 | 85.00 | 1912500 |
| 28 | sale | 11250 | 150.00 | 1687500 |
| 30 | sale | 3750 | 150.00 | 562500 |
| Feb. 5 | sale | 1500 | 150.00 | 225000 |
| 10 | purchase | 54000 | 87.50 | 4725000 |
| 16 | sale | 27000 | 160.00 | 4320000 |
| 28 | sale | 25500 | 160.00 | 4080000 |
| Mar. 5 | purchase | 45000 | 89.50 | 4027500 |
| 14 | sale | 30000 | 160.00 | 4800000 |
| 25 | purchase | 7500 | 90.00 | 675000 |
| 30 | sale | 26250 | 160.00 | 4200000 |
That is all the information that was provided, thank you !
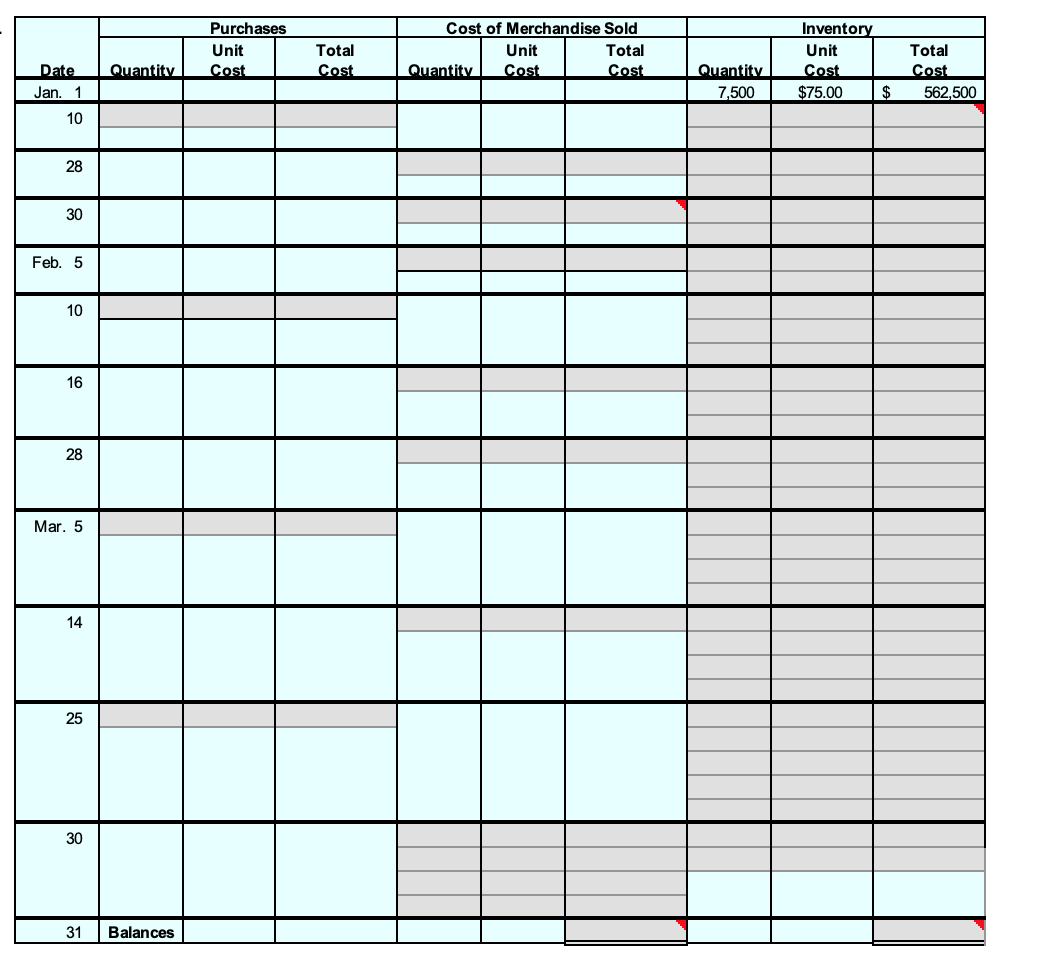
PR 7-2A LIFO perpetual inventory OBJ. 2, 3 The beginning inventory at Midnight Supplies and data on purchases and sales for a three-month period are shown in Problem 7-1A. Instructions 1. Record the inventory, purchases, and cost of merchandise sold data in a perpetual inventory record similar to the one illustrated in Exhibit 4, using the last-in, first-out method. 2. Determine the total sales, the total cost of merchandise sold, and the gross profit from sales for the period. 3. Determine the ending inventory cost as of March 31. Date Jan. 1 10 28 30 Feb. 5 10 16 28 Mar. 5 14 25 30 31 Quantity Balances Purchases Unit Cost Total Cost Cost of Merchandise Sold Total Cost Quantity Unit Cost Quantity 7,500 Inventory Unit Cost $75.00 $ Total Cost 562,500 Total sales Total cost of merchandise sold Gross profit Ending inventory cost
Step by Step Solution
There are 3 Steps involved in it

Get step-by-step solutions from verified subject matter experts