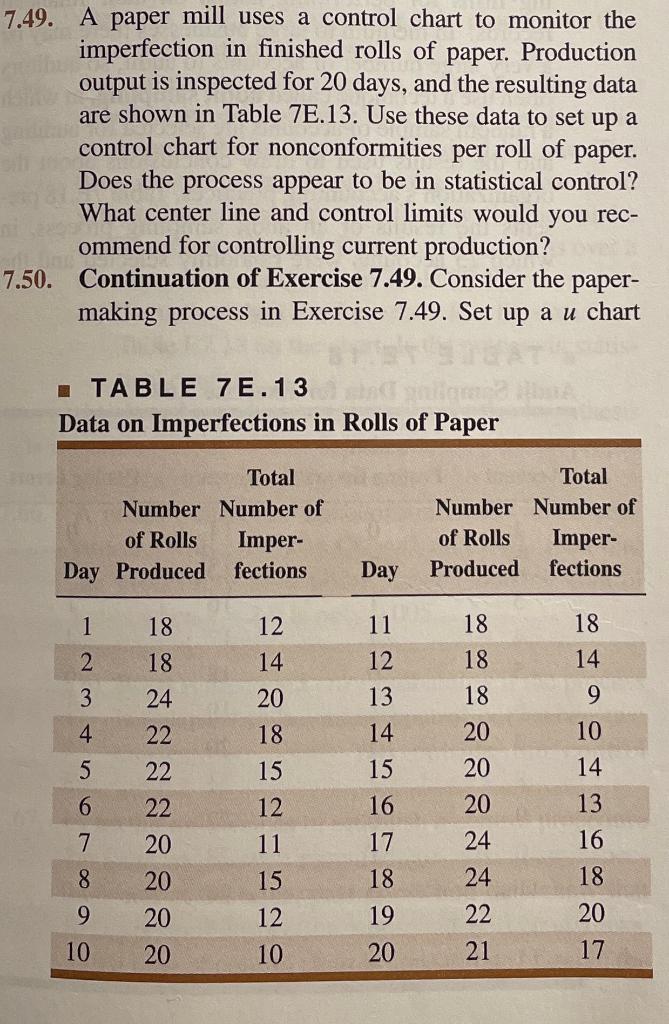
Question: 7.49 please 7.49. A paper mill uses a control chart to monitor the imperfection in finished rolls of paper. Production output is inspected for 20

7.49 please

7.49 please 7.49. A paper mill uses a control

7.49. A paper mill uses a control chart to monitor the imperfection in finished rolls of paper. Production output is inspected for 20 days, and the resulting data are shown in Table 7E.13. Use these data to set up a control chart for nonconformities per roll of paper. Does the process appear to be in statistical control? What center line and control limits would you rec- ommend for controlling current production? 7.50. Continuation of Exercise 7.49. Consider the paper- making process in Exercise 7.49. Set up a u chart TABLE 7E.13 Data on Imperfections in Rolls of Paper Total Number Number of of Rolls Imper- Day Produced fections Total Number Number of of Rolls Imper- Produced fections Day 1 18 12 18 18 18 14 2 11 12 13 18 14 20 3 24 9 18 20 22 18 4 5 15 14 15 16 20 10 14 13 6 22 22 20 20 20 24 7 17 16 12 11 15 12 8 18 24 18 9 20 19 22 20 10 20 10 20 21 17

Step by Step Solution

There are 3 Steps involved in it

1 Expert Approved Answer
Step: 1 Unlock blur-text-image
Question Has Been Solved by an Expert!

Get step-by-step solutions from verified subject matter experts

Step: 2 Unlock
Step: 3 Unlock

Students Have Also Explored These Related General Management Questions!