

Question: 7.5 Data for hydrogen are given by Dymond and Smith (1969) as, T(K) 19 25 30 40 50 75 100 150 200 300 400 B(cm/mole)
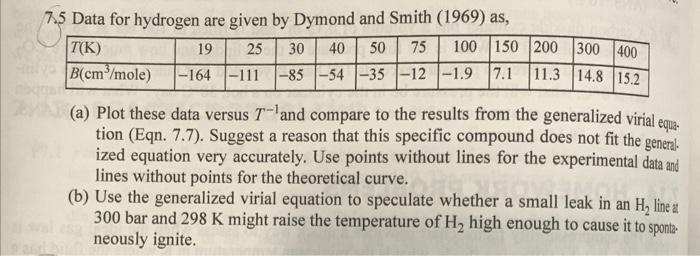
7.5 Data for hydrogen are given by Dymond and Smith (1969) as, T(K) 19 25 30 40 50 75 100 150 200 300 400 B(cm/mole) -164 -111 -85 -54 -35 -12 -1.9 7.1 11.3 14.8 15.2 (a) Plot these data versus T- and compare to the results from the generalized virial equa- tion (Eqn. 7.7). Suggest a reason that this specific compound does not fit the general ized equation very accurately. Use points without lines for the experimental data and lines without points for the theoretical curve. (b) Use the generalized virial equation to speculate whether a small leak in an H, line at 300 bar and 298 K might raise the temperature of H, high enough to cause it to sponta- neously ignite
Step by Step Solution
There are 3 Steps involved in it

Get step-by-step solutions from verified subject matter experts